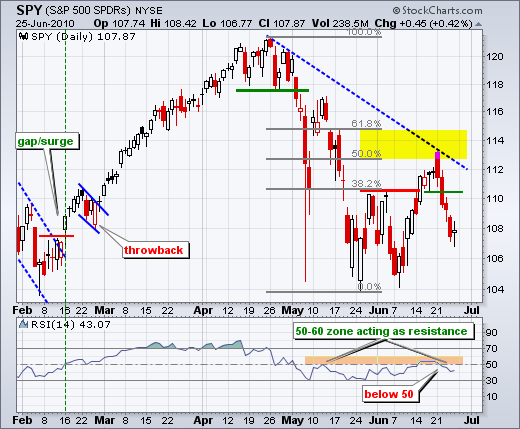
After a four day decline, SPY formed a big spinning top to establish a potential support zone around 107-108. These candlesticks have small bodies and long upper/lower shadows. The small bodies reflect little change from open to close. The upper and lower shadows indicate movement during the day that failed to hold. Also notice that Friday's body is within the Thursday's body to make this a harami over the last two days. Even though the prospects of a short-term bounce are improving, last week's decline was sharper than expected for a mere correction based on profit taking. A lower high formed near the 50% retracement mark and there is considerable resistance in the 110-112 area. RSI failed to break above the 50-60 zone and moved below 50 to keep momentum bearish.

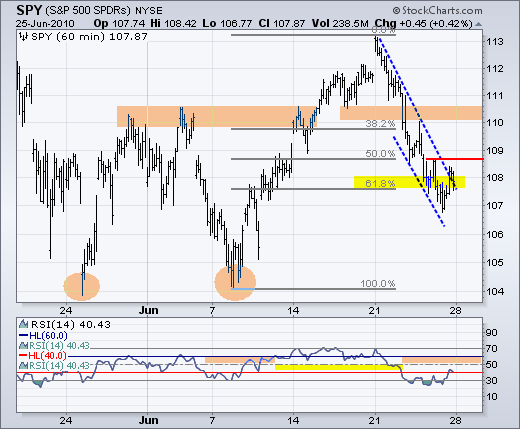
On the 60-minute chart, SPY formed a double bottom and broke resistance with a surge above 110.50 in mid June. This breakout looked quite strong at the time, but the ETF came crashing back through broken resistance with last week's decline. While the depth and strength of the decline are a concern, it should be noted that SPY formed Friday's spinning top near the 62% retracement mark. The ETF also became oversold as RSI dipped below 30 numerous times last week. At this point, we could see an oversold bounce back towards the 110-110.5 area. This area acted as resistance in late May and early June. This area also marks broken support and resistance over the last two weeks.
It is a busy week on the economic calendar with the employment report due on Friday. The last report (June 4th) sent stocks sharply lower after non-farm payrolls grew less than expected. This report could have an amplified impact because trading may be thin on Friday. Monday, July 5th, is an exchange holiday and traders may look to get a jump on the weekend with an early exit on Friday. Hey, I am thinking that way myself!
Key Economic Reports:
Jun 29 - 09:00 - Case-Shiller Index
Jun 29 - 10:00 - Consumer Confidence
Jun 30 - 08:15 - ADP Employment Report
Jun 30 - 09:45 - Chicago PMI
Jun 30 - 10:30 - Crude Inventories
Jul 01 - 08:30 - Initial Claims
Jul 01 - 10:00 - ISM Index
Jul 01 - 10:00 - Pending Home Sales
Jul 01 - 14:00 - Auto-Truck Sales
Jul 02 - 08:30 - Unemployment Report
Jul 02 - 10:00 - Factory Orders
Charts of Interest: DE, NUE, PCLN, POT, V
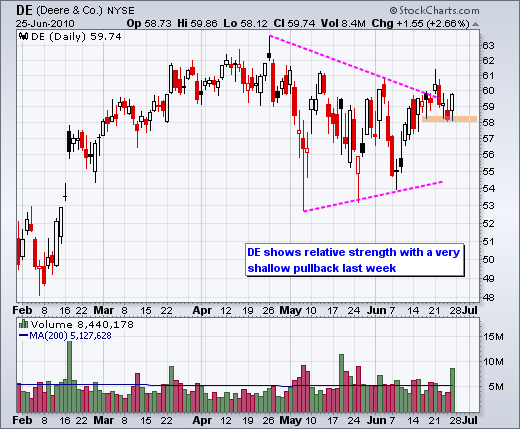
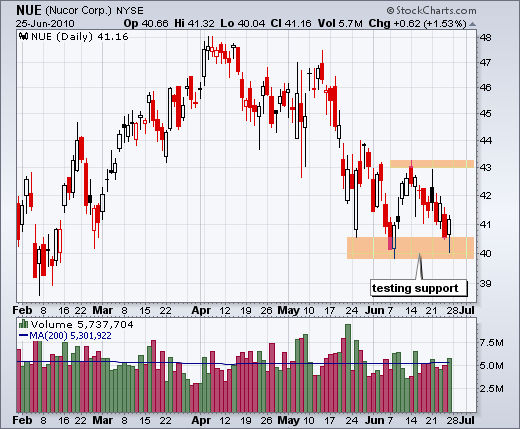
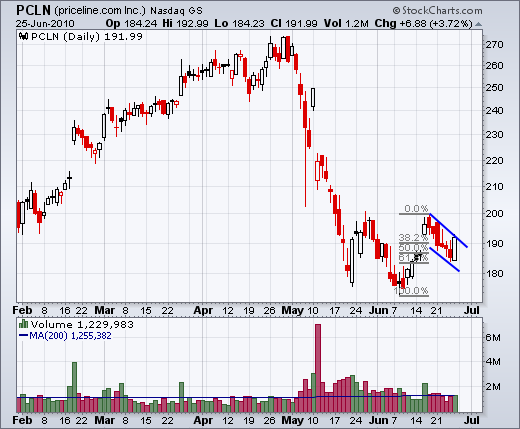
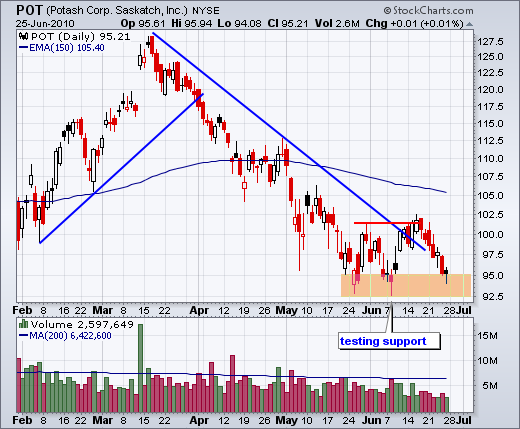
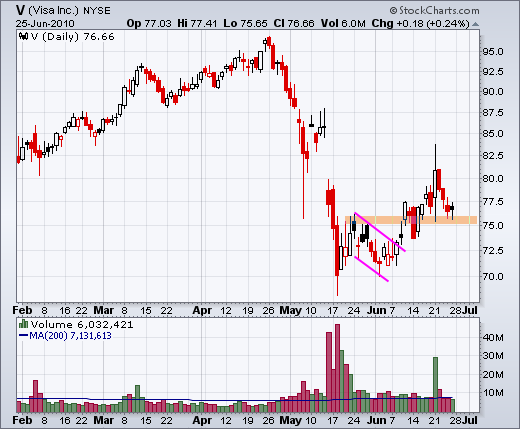
This commentary and charts-of-interest are designed to stimulate thinking. This analysis is not a recommendation to buy, sell, hold or sell short any security (stock ETF or otherwise). We all need to think for ourselves when it comes to trading our own accounts. First, it is the only way to really learn. Second, we are the only ones responsible for our decisions. Think of these charts as food for further analysis. Before making a trade, it is important to have a plan. Plan the trade and trade the plan. Among other things, this includes setting a trigger level, a target area and a stop-loss level. It is also important to plan for three possible price movements: advance, decline or sideways. Have a plan for all three scenarios BEFORE making the trade. Consider possible holding times. And finally, look at overall market conditions and sector/industry performance.

About the author:
Arthur Hill, CMT, is the Chief Technical Strategist at TrendInvestorPro.com. Focusing predominantly on US equities and ETFs, his systematic approach of identifying trend, finding signals within the trend, and setting key price levels has made him an esteemed market technician. Arthur has written articles for numerous financial publications including Barrons and Stocks & Commodities Magazine. In addition to his Chartered Market Technician (CMT) designation, he holds an MBA from the Cass Business School at City University in London.
Learn More


