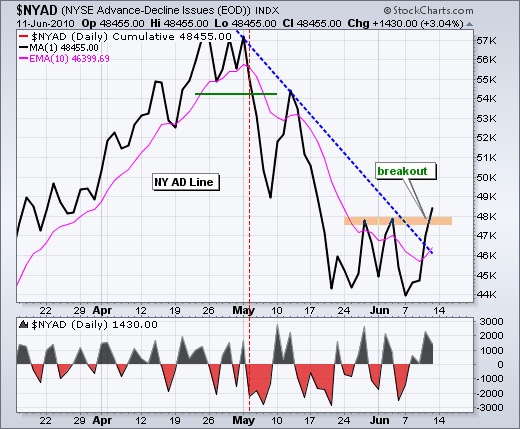
The surge over the last two days did not occur on the strongest breadth or volume, but support from the February low held and the bigger uptrend remains in place. As long as the bigger trend is up, the odds favor the bulls as SPY surges off support. Selling pressure in early June was less than selling pressure in early May or mid-late May. This is true for the Nasdaq and NYSE. In essence, May marked the big decline and June marked the test with less selling pressure. In particular, I am impressed with the NYSE AD Line because it is the only breadth line to break its late May high. The NYSE AD Volume Line, Nasdaq AD Line and Nasdaq AD Volume Line remain below their late May highs. Leadership from the NYSE AD Line indicates relative strength in non-tech small and mid-caps. The chart below shows the NYSE AD Line breaking resistance with a surge over the last four days. That's right. Net Advances were positive the last four days. Not bad.

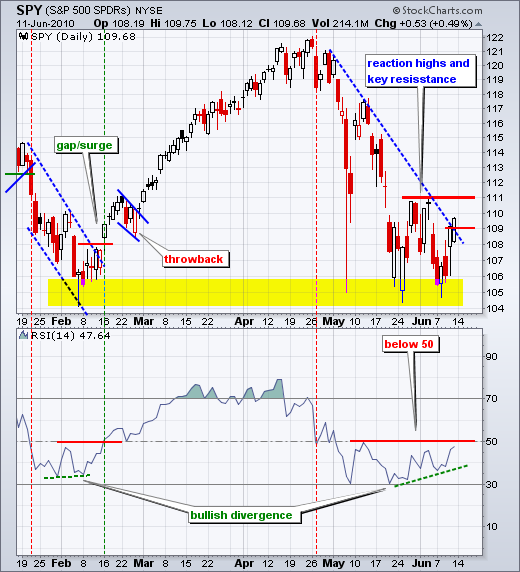
The daily chart shows SPY surging off support with an advance three of the last four days. There was a mini-reversal day on Tuesday and a harmami on Monday-Tuesday. SPY opened strong on Wednesday, but failed to hold gains and closed weak. The ETF answered with a strong open and strong close on Thursday. After a weak open on Friday, SPY rallied and closed the week strong. SPY closed strong three of the last four days. With key resistance at 111 in sight, the ETF has an important test ahead this week. A break above 111 would forge a higher high and reverse the seven week downtrend. RSI remains with a small bullish divergence over the last four weeks and an upturn this week. A break above 50 would turn momentum bullish. At this point, I think the cup is half full and the odds favor a breakout at 111. A move below 107 would fill Thursday's gap and argue for a reassessment.
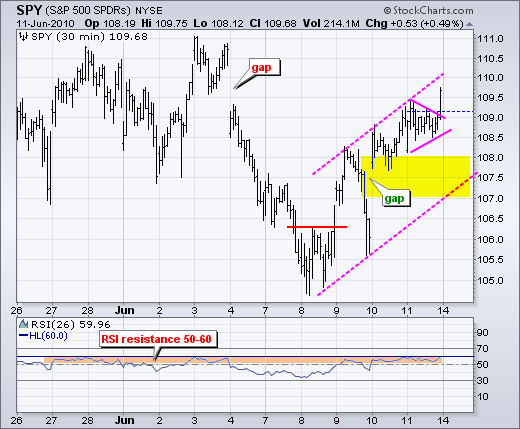
On the 30-minute chart, SPY consolidated for most of the day and then broke resistance with a surge in the last hour. Since gapping above 107.50, the ETF has worked its way higher the last two days and held the gap. A sudden move below 108.4 would be short-term negative, but I am marking a more important support zone around 107-108. This zone captures the big gap and the rising channel. A break below 107 would show too much weakness for just a pullback and clearly reverse the four day uptrend. RSI finished at 59.96, which is just short of a breakout. RSI was turned back at 60 on May 27th and June 3rd. This is also an important test for momentum.
Key Economic Reports:
Wed - Jun 16 - 08:30 - Housing Starts
Wed - Jun 16 - 08:30 - Building Permits
Wed - Jun 16 - 08:30 - PPI
Wed - Jun 16 - 09:15 - Industrial Production
Wed - Jun 16 - 10:30 - Crude Inventories
Thu - Jun 17 - 08:30 - Initial Claims
Thu - Jun 17 - 08:30 - CPI
Thu - Jun 17 - 10:00 - Leading Indicators
Thu - Jun 17 - 10:00 - Philadelphia Fed
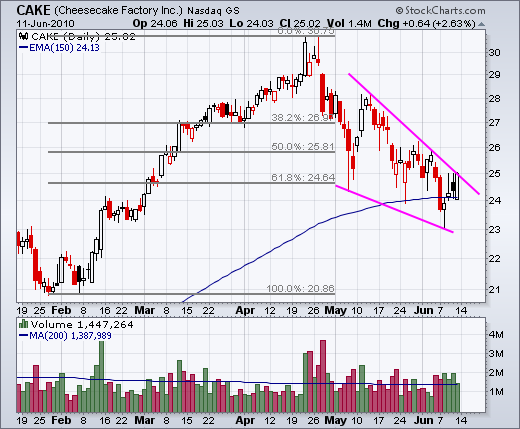
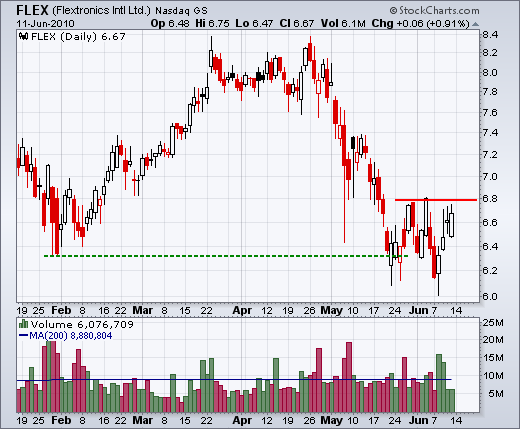
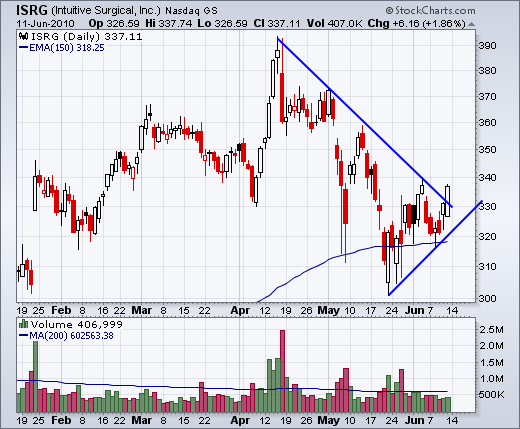
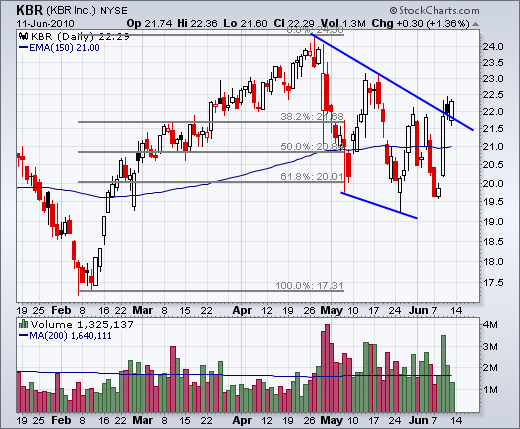
Charts of Interest: CAKE, FLEX, ISRG, KBR
This commentary and charts-of-interest are designed to stimulate thinking. This analysis is not a recommendation to buy, sell, hold or sell short any security (stock ETF or otherwise). We all need to think for ourselves when it comes to trading our own accounts. First, it is the only way to really learn. Second, we are the only ones responsible for our decisions. Think of these charts as food for further analysis. Before making a trade, it is important to have a plan. Plan the trade and trade the plan. Among other things, this includes setting a trigger level, a target area and a stop-loss level. It is also important to plan for three possible price movements: advance, decline or sideways. Have a plan for all three scenarios BEFORE making the trade. Consider possible holding times. And finally, look at overall market conditions and sector/industry performance.

On the 30-minute chart, SPY consolidated for most of the day and then broke resistance with a surge in the last hour. Since gapping above 107.50, the ETF has worked its way higher the last two days and held the gap. A sudden move below 108.4 would be short-term negative, but I am marking a more important support zone around 107-108. This zone captures the big gap and the rising channel. A break below 107 would show too much weakness for just a pullback and clearly reverse the four day uptrend. RSI finished at 59.96, which is just short of a breakout. RSI was turned back at 60 on May 27th and June 3rd. This is also an important test for momentum.

Key Economic Reports:
Wed - Jun 16 - 08:30 - Housing Starts
Wed - Jun 16 - 08:30 - Building Permits
Wed - Jun 16 - 08:30 - PPI
Wed - Jun 16 - 09:15 - Industrial Production
Wed - Jun 16 - 10:30 - Crude Inventories
Thu - Jun 17 - 08:30 - Initial Claims
Thu - Jun 17 - 08:30 - CPI
Thu - Jun 17 - 10:00 - Leading Indicators
Thu - Jun 17 - 10:00 - Philadelphia Fed
Charts of Interest: CAKE, FLEX, ISRG, KBR


This commentary and charts-of-interest are designed to stimulate thinking. This analysis is not a recommendation to buy, sell, hold or sell short any security (stock ETF or otherwise). We all need to think for ourselves when it comes to trading our own accounts. First, it is the only way to really learn. Second, we are the only ones responsible for our decisions. Think of these charts as food for further analysis. Before making a trade, it is important to have a plan. Plan the trade and trade the plan. Among other things, this includes setting a trigger level, a target area and a stop-loss level. It is also important to plan for three possible price movements: advance, decline or sideways. Have a plan for all three scenarios BEFORE making the trade. Consider possible holding times. And finally, look at overall market conditions and sector/industry performance.

About the author:
Arthur Hill, CMT, is the Chief Technical Strategist at TrendInvestorPro.com. Focusing predominantly on US equities and ETFs, his systematic approach of identifying trend, finding signals within the trend, and setting key price levels has made him an esteemed market technician. Arthur has written articles for numerous financial publications including Barrons and Stocks & Commodities Magazine. In addition to his Chartered Market Technician (CMT) designation, he holds an MBA from the Cass Business School at City University in London.
Learn More


