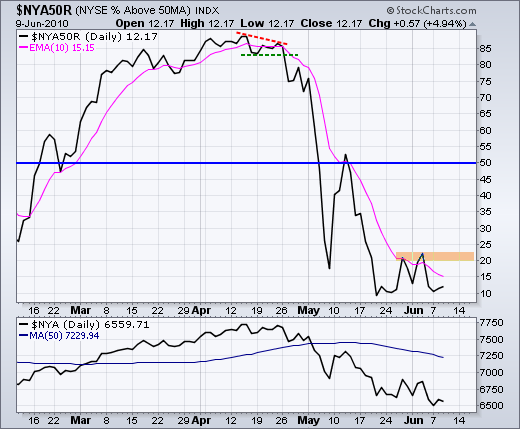
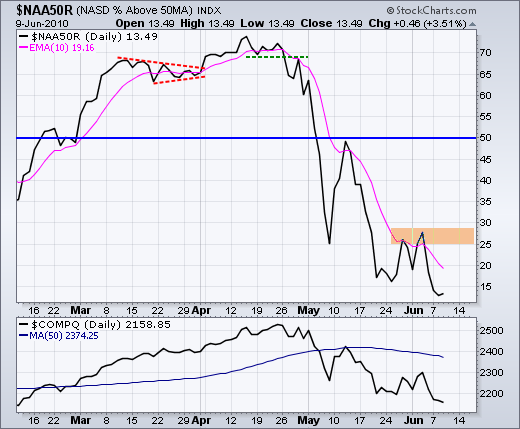
Stocks surged in early trading with SPY moving above 108 in the morning, but gave back these gains, and more, with an afternoon plunge. There it is again: another late round of selling pressure. A lack of buying pressure and a small increase in selling pressure is all it takes to pull the rug out from under the stock market. This is the treacherous trading world we live in right now. Overall, stocks remain oversold and ripe for a bounce, but this bounce is proving difficult because the 6-7 week downtrend is proving stronger. The chart below shows the NYSE %Above 50-day SMA ($NYA50R) moving to 12.17%. The indicator has been bouncing off the 10% level the last 3-4 weeks. Truth be told, it is pretty hard to go below 10%. More importantly, for the bulls, the indicator cannot hold a breakout either. Resistance in the low 20% area is the first area to watch. A break above this level would be quite positive for stocks. The second chart shows the Nasdaq %Above 50-day SMA ($NAA50R) hitting resistance just below 30%. It is interesting to note that more Nasdaq stocks are above their 50-day lines than NYSE stocks.


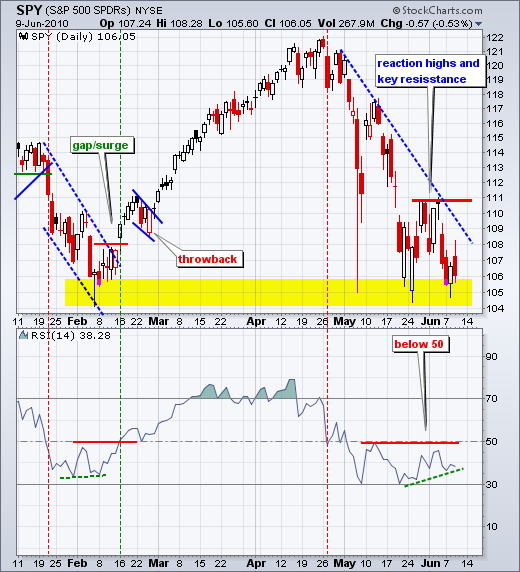
There is no real change on the SPY daily chart. The ETF surged and failed to hold its surge. The downtrend remains and it is possible that a small head-and-shoulders pattern is forming from late May to now. A break below the May low would signal a continuation lower and project further weakness to the 99-100 area. Support from the May-June lows is holding for now. RSI also has a bullish divergence working with a higher low over the last few weeks. A break above 50 is needed to turn momentum bullish here.

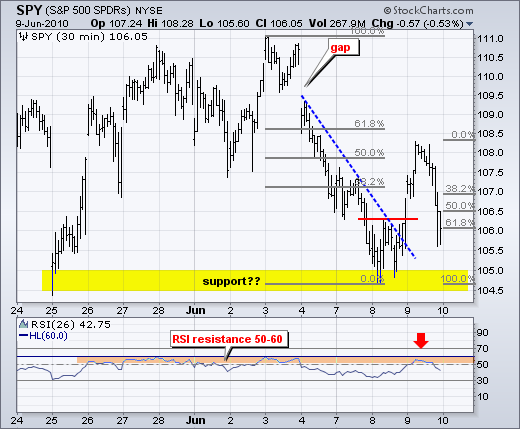
On the 30-minute chart, SPY failed in the 50-62% retracement zone and RSI failed in the 50-60 zone. The ETF moved below the breakout and ended the day with a 62% retracement of the prior advance (104.65 to 108.18). This is the make-or-break area for SPY. If this is just a pullback, we should see support near current levels. Failure to hold 105.5 would open the door to a bigger support break, namely the May-June lows.
Thu - Jun 10 - 08:30 - Initial Claims
Fri - Jun 11 - 08:30 - Retail Sales
Fri - Jun 11 - 09:55 - Michigan Sentiment
Charts of Interest: None today.
This commentary and charts-of-interest are designed to stimulate thinking. This analysis is not a recommendation to buy, sell, hold or sell short any security (stock ETF or otherwise). We all need to think for ourselves when it comes to trading our own accounts. First, it is the only way to really learn. Second, we are the only ones responsible for our decisions. Think of these charts as food for further analysis. Before making a trade, it is important to have a plan. Plan the trade and trade the plan. Among other things, this includes setting a trigger level, a target area and a stop-loss level. It is also important to plan for three possible price movements: advance, decline or sideways. Have a plan for all three scenarios BEFORE making the trade. Consider possible holding times. And finally, look at overall market conditions and sector/industry performance.

About the author:
Arthur Hill, CMT, is the Chief Technical Strategist at TrendInvestorPro.com. Focusing predominantly on US equities and ETFs, his systematic approach of identifying trend, finding signals within the trend, and setting key price levels has made him an esteemed market technician. Arthur has written articles for numerous financial publications including Barrons and Stocks & Commodities Magazine. In addition to his Chartered Market Technician (CMT) designation, he holds an MBA from the Cass Business School at City University in London.
Learn More


