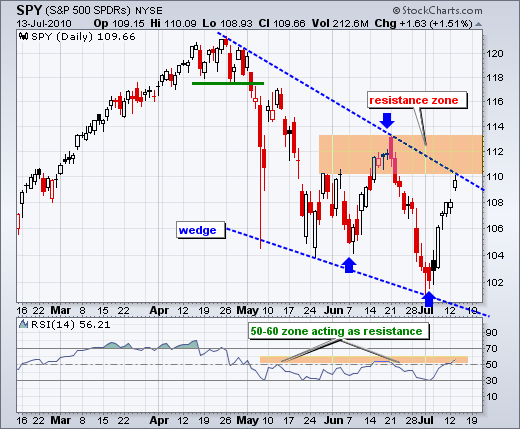
Stocks were oversold 7-8 days ago and an oversold bounce was expected. However, I must admit that I did not expect a move all the way to the 110-113 resistance zone, especially after sharpness of the prior decline. On a closing basis, there have been three moves in excess of 6% over the last 25 days (blue arrows). First, SPY bottomed on June 7th and advanced 6.4% in nine days. Second, the ETF peaked on June 18th and fell 8.5% in ten days. Most recently, SPY bottomed on July 2nd and surged 7.2% the last six days. These moves are likely great for swing traders, but confusing to investors. At this point, the trend on the daily chart remains down as SPY trades within a falling wedge. The ETF has a series of lower lows and lower highs since April. With Tuesday's gap/surge, the ETF hit the lower end of its resistance zone and the wedge trendline. In addition, RSI moved further into the 50-60 zone, which can act as resistance in a downtrend, provided the trend remains down. This marks a moment-of-truth on the daily chart.


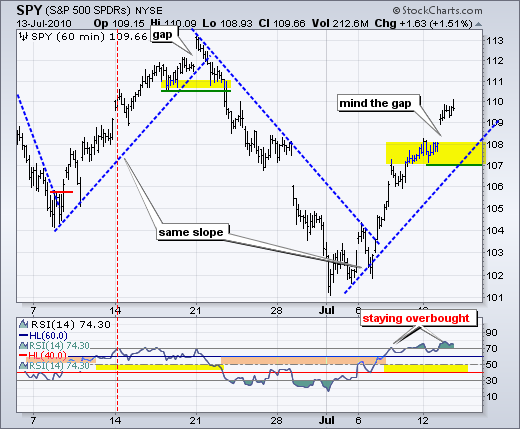
On the 60-minute chart, SPY blew through the 50-62% retracement zone with a gap above 109 on Tuesday. The trend is no doubt up, but getting long on tooth (overextended). First, we must mind the gap, which is bullish as long as it holds. A move below 108 would fill the gap and be the first sign of selling pressure. Second, I am marking a support zone around 107-108. This stems from last week's resistance and Monday's low. Third, there is a trendline extending up from early July that defines the rate of ascent. Without reaction lows upon which to base a trendline, I drew a trendline parallel to the mid June trendline. These rallies look similar. Also notice that the June advance ended with an exhaustion gap. RSI continues to trade on either side of 70 as momentum remains strong. It would take a move below 40 to turn momentum bearish.

Economic reports kick into high gear Wednesday, Thursday and Friday. Today's retail sales is the biggie here. Retail sales drive some 2/3 of GDP and the consumer discretionary sector has been relatively weak since mid June. The bond market will be watching the Fed minutes on Wednesday and the inflation related reports (PPI and CPI). The week ends with another measure of consumer health with Michigan sentiment on Friday morning.
Key Economic Reports:
Wed - Jul 14 - 08:30 - Retail Sales
Wed - Jul 14 - 10:00 - Business Inventories
Wed - Jul 14 - 10:30 - Crude Inventories
Wed - Jul 14 - 14:00 - Minutes of FOMC Meeting
Thu - Jul 15 - 08:30 - Initial Claims
Thu - Jul 15 - 08:30 - PPI
Thu - Jul 15 - 09:15 - Industrial Production
Thu - Jul 15 - 09:15 - Capacity Utilization
Fri - Jul 16 - 08:30 - CPI
Fri - Jul 16 - 09:55 - Mich Sentiment
Charts of Interest: None today.
This commentary and charts-of-interest are designed to stimulate thinking. This analysis is not a recommendation to buy, sell, hold or sell short any security (stock ETF or otherwise). We all need to think for ourselves when it comes to trading our own accounts. First, it is the only way to really learn. Second, we are the only ones responsible for our decisions. Think of these charts as food for further analysis. Before making a trade, it is important to have a plan. Plan the trade and trade the plan. Among other things, this includes setting a trigger level, a target area and a stop-loss level. It is also important to plan for three possible price movements: advance, decline or sideways. Have a plan for all three scenarios BEFORE making the trade. Consider possible holding times. And finally, look at overall market conditions and sector/industry performance.

About the author:
Arthur Hill, CMT, is the Chief Technical Strategist at TrendInvestorPro.com. Focusing predominantly on US equities and ETFs, his systematic approach of identifying trend, finding signals within the trend, and setting key price levels has made him an esteemed market technician. Arthur has written articles for numerous financial publications including Barrons and Stocks & Commodities Magazine. In addition to his Chartered Market Technician (CMT) designation, he holds an MBA from the Cass Business School at City University in London.
Learn More


