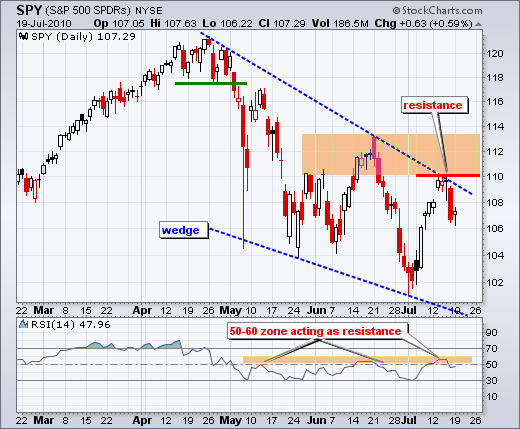
On the daily chart, the S&P 500 ETF (SPY) stalled with a small gain on the day. After Friday's sharp decline, a little indecision or a small rebound is normal. There is really no change on the daily chart. The falling wedge still dominates the overall picture and defines the downtrend. With last week's decline, SPY formed a lower high, well below the mid June high. This keeps the series of lower lows and lower highs in place. Key resistance remains at 110. A recovery and break above this level would call for a reassessment of the current downtrend. Momentum remains in bear mode as RSI trades in the 20-60 range. The indicator hit resistance in the 50-60 zone for the third time since late May. A break above 60 is needed to turn momentum bullish here.


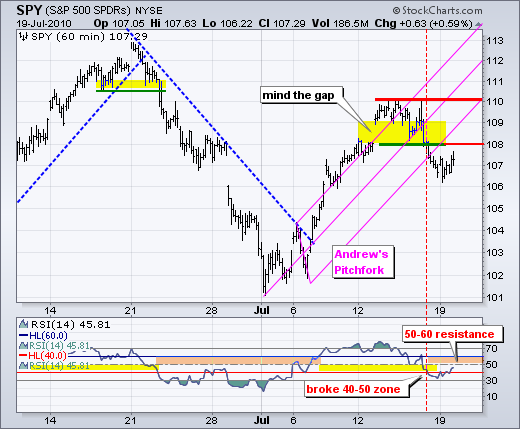
On the 30-minute chart, SPY broke support at 108 and broken support turns into the first resistance level to watch. As noted yesterday, a throwback rally or oversold bounce is quite common. I would not view a break above 108 as significant. Instead, I would still expect resistance sooner rather than later (108-109). Only a sharp move higher with good volume and breadth would warrant a reassessment of the current downtrend. RSI broke below 40 to turn momentum bearish last week. The 50-60 zone now turns into resistance. A break above 60 is needed to turn momentum bullish again. Short vacation: I will be taking a short break from Wednesday to Friday. Updates to Art's Charts will resume on Monday, July 26.

Key Economic Reports:
Tue - Jul 20 - 08:30 - Housing Starts
Wed - Jul 21 - 10:00 - Bernanke Testifies before Senate
Wed - Jul 21 - 10:30 - Crude Inventories
Thu - Jul 22 - 08:30 - Initial Claims
Thu - Jul 22 - 09:30 - Bernanke Testifies before House
Thu - Jul 22 - 10:00 - Existing Home Sales
Thu - Jul 22 - 10:00 - Leading Indicators
Charts of Interest: None today.
This commentary and charts-of-interest are designed to stimulate thinking. This analysis is not a recommendation to buy, sell, hold or sell short any security (stock ETF or otherwise). We all need to think for ourselves when it comes to trading our own accounts. First, it is the only way to really learn. Second, we are the only ones responsible for our decisions. Think of these charts as food for further analysis. Before making a trade, it is important to have a plan. Plan the trade and trade the plan. Among other things, this includes setting a trigger level, a target area and a stop-loss level. It is also important to plan for three possible price movements: advance, decline or sideways. Have a plan for all three scenarios BEFORE making the trade. Consider possible holding times. And finally, look at overall market conditions and sector/industry performance.

About the author:
Arthur Hill, CMT, is the Chief Technical Strategist at TrendInvestorPro.com. Focusing predominantly on US equities and ETFs, his systematic approach of identifying trend, finding signals within the trend, and setting key price levels has made him an esteemed market technician. Arthur has written articles for numerous financial publications including Barrons and Stocks & Commodities Magazine. In addition to his Chartered Market Technician (CMT) designation, he holds an MBA from the Cass Business School at City University in London.
Learn More


