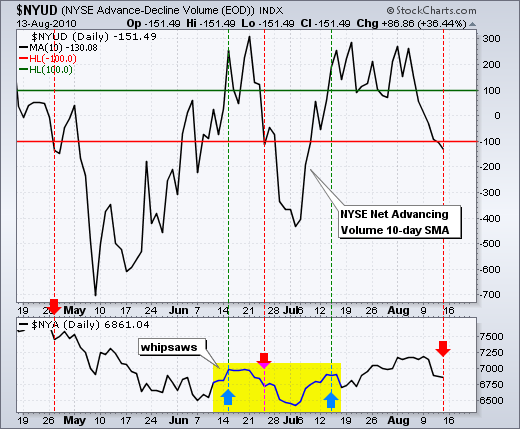
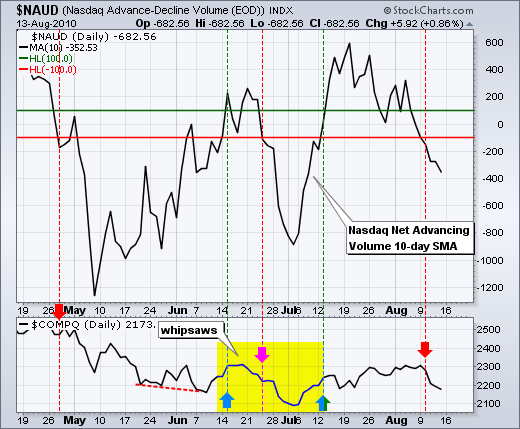
Selling pressure was intense enough to produce a short-term breadth breakdown. The charts below show the 10-day SMA for Net Advancing Volume for the Nasdaq and NYSE. Net Advancing Volume is simply the volume of advancing stocks less the volume of declining stocks. A move above +100 shows a significant surge in buying pressure, while a move below -100 shows a significant surge in selling pressure. Even though this indicator/system is not immune to whipsaws, it can help keep us on the right side of the short-term trend, which I believe is down until proven otherwise. The Nasdaq indicator broke below -100 early in the week (Monday) and the NYSE indicator broke down at the end of the week. This tells me that there was a significant increase in selling pressure last week.


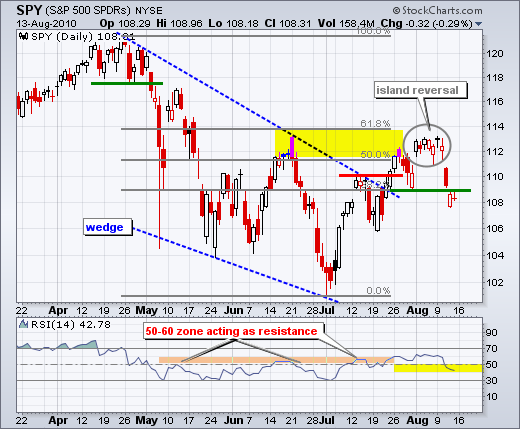
On the daily chart, the S&P 500 ETF (SPY) formed an island reversal and broke below support at 109 last week. Also notice that the ETF reversed course in the 112 resistance area, which marked a 50-62% retracement of the prior decline and resistance from the June high. Even though I view the failure at resistance and island reversal as bearish, there are three concerns with this bearish stance. First, sentiment seems overwhelmingly bearish. The Hindenburg Omen was reported everywhere over the past week. Second, SPY has potential support in the 106-108 area. Volatility has been extremely high lately and this increases the chances of overshoots. Perhaps Wednesday's sharp decline below 109 was an overshoot driven by volatility and thin trading. Third, RSI remains in the 40-50 zone, which acts as support in a uptrend. Despite these concerns, I will still make the market prove my bearish stance otherwise with a surge back above 112.

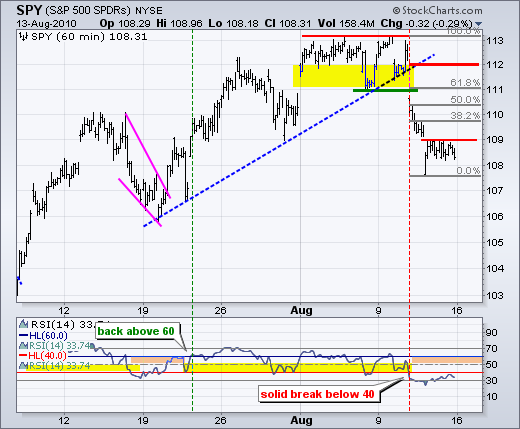
On the 60-minute chart, SPY gapped below 109 on Thursday morning and then firmed until the end of the week. A tight consolidation formed with support at 108 and resistance at 109. These levels can be used for aggressive traders to play a bounce/breakout or further weakness with a support break. An oversold bounce could retrace 50-62% of the prior decline. Broken support and the 62% retracement merge around 111 and this is the next resistance area to watch if SPY breaks above 109. RSI remains in bear mode after a solid break below 40. The 50-60 zone now become resistance.

Key Economic Reports:
Tue - Aug 17 - 08:30 - Housing Starts
Tue - Aug 17 - 08:30 - PPI
Tue - Aug 17 - 09:15 - Industrial Production
Wed - Aug 18 - 10:30 - Oil Inventories
Thu - Aug 19 - 08:30 - Jobless Claims
Thu - Aug 19 - 10:00 - Leading Indicators
Charts of Interest: Posted Tuesday and Thursday.
This commentary and charts-of-interest are designed to stimulate thinking. This analysis is not a recommendation to buy, sell, hold or sell short any security (stock ETF or otherwise). We all need to think for ourselves when it comes to trading our own accounts. First, it is the only way to really learn. Second, we are the only ones responsible for our decisions. Think of these charts as food for further analysis. Before making a trade, it is important to have a plan. Plan the trade and trade the plan. Among other things, this includes setting a trigger level, a target area and a stop-loss level. It is also important to plan for three possible price movements: advance, decline or sideways. Have a plan for all three scenarios BEFORE making the trade. Consider possible holding times. And finally, look at overall market conditions and sector/industry performance.

About the author:
Arthur Hill, CMT, is the Chief Technical Strategist at TrendInvestorPro.com. Focusing predominantly on US equities and ETFs, his systematic approach of identifying trend, finding signals within the trend, and setting key price levels has made him an esteemed market technician. Arthur has written articles for numerous financial publications including Barrons and Stocks & Commodities Magazine. In addition to his Chartered Market Technician (CMT) designation, he holds an MBA from the Cass Business School at City University in London.
Learn More


