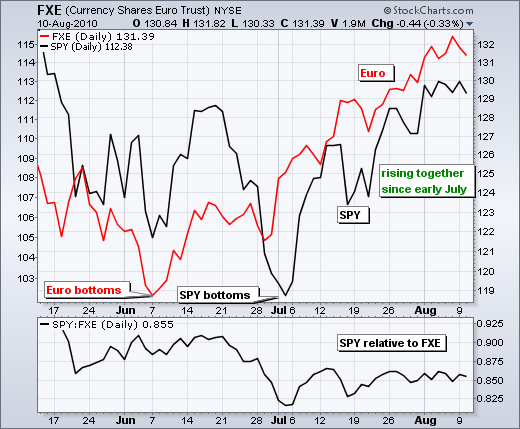
Even though stocks bounced after the Fed announcement, S&P futures are down sharply in pre-market trading today. European and Asian stocks are also lower this morning. The Euro is getting slammed (130.5) and this may signal a return to the risk-off trade. Earning season is passing, the employment report is out and the Fed made its policy statement. It is August 11th and September is just around the corner. The news cycle was quite positive from early July until early August. "Cycle" is the key word here. The market could very well start changing its focus as European vacations end with stocks trading at lofty levels.


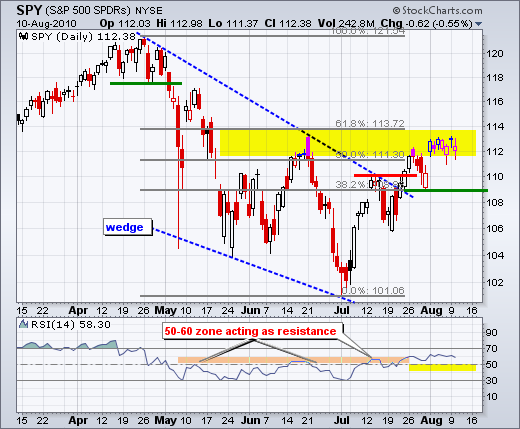
There is no real change on the daily chart as SPY consolidates around 112. A consolidation break with a move above 113.2 would signal a continuation higher. Barring such a move, there is a good argument for top pickers with the ETF stalling in a clear resistance zone. As far as the medium-term uptrend is concerned, I will wait for a break below daily chart support at 109 before considering the wedge breakout a failure.

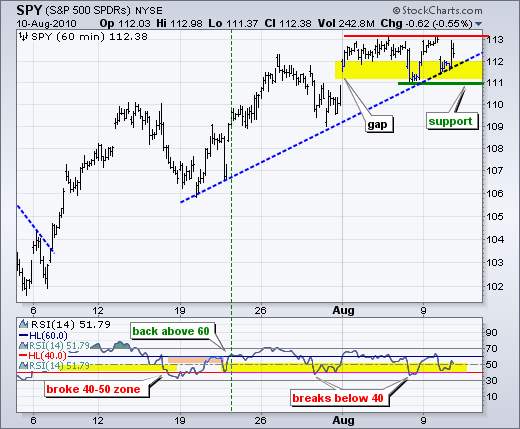
On the 60-minute chart, SPY gapped down into the support zone on the open, but surged in the afternoon to close above 112 for the seventh straight day. Last week's gap, Friday's low and yesterday's bounce established support in the 111-111.5 area. A break below this level would reverse the short-term uptrend and call for at least a retracement of the July-August advance. A 50% retracement of the move from 102 to 113 would extend to the 107.5 area. RSI dipped below 40 twice in the past two weeks, but recovered each time. The third time might not be so lucky, especially if confirmed with a support break in SPY.

Key Economic Reports:
Wed - Aug 11 - 10:30 - Crude Inventories
Thu - Aug 12 - 08:30 - Initial Claims
Fri - Aug 13 - 08:30 - CPI
Fri - Aug 13 - 08:30 - Retail Sales
Fri - Aug 13 - 09:55 - Michigan Sentiment
Fri - Aug 13 - 10:00 - Business Inventories
Charts of Interest: None today.
This commentary and charts-of-interest are designed to stimulate thinking. This analysis is not a recommendation to buy, sell, hold or sell short any security (stock ETF or otherwise). We all need to think for ourselves when it comes to trading our own accounts. First, it is the only way to really learn. Second, we are the only ones responsible for our decisions. Think of these charts as food for further analysis. Before making a trade, it is important to have a plan. Plan the trade and trade the plan. Among other things, this includes setting a trigger level, a target area and a stop-loss level. It is also important to plan for three possible price movements: advance, decline or sideways. Have a plan for all three scenarios BEFORE making the trade. Consider possible holding times. And finally, look at overall market conditions and sector/industry performance.

About the author:
Arthur Hill, CMT, is the Chief Technical Strategist at TrendInvestorPro.com. Focusing predominantly on US equities and ETFs, his systematic approach of identifying trend, finding signals within the trend, and setting key price levels has made him an esteemed market technician. Arthur has written articles for numerous financial publications including Barrons and Stocks & Commodities Magazine. In addition to his Chartered Market Technician (CMT) designation, he holds an MBA from the Cass Business School at City University in London.
Learn More


