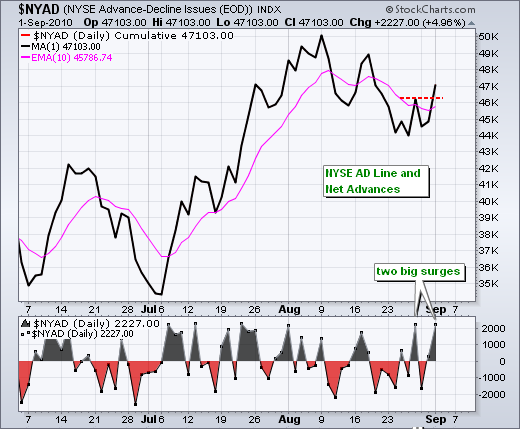
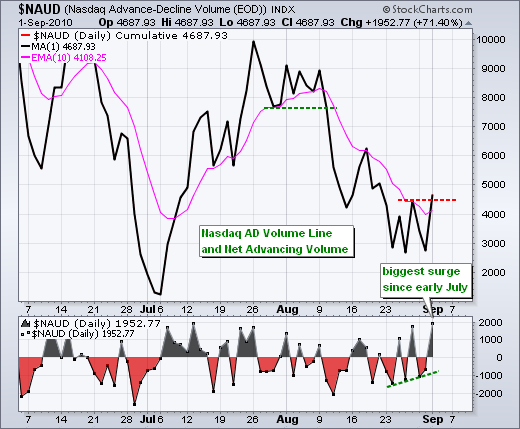
Stocks around the world surged on Wednesday with many stock indices breaking out of their August downtrends. In the US, small-caps led the way higher with the Russell 2000 surging 3.81%. The Nasdaq and S&P 500 were both up around 3%. All sectors were up with consumer discretionary, energy, finance and industrials leading the way. Technology was relatively weak with a 2.56% gain on the day. Breadth also surged as the NYSE AD Line broke above Monday's high. NYSE Net Advances have now surged above +2000 twice in the last two weeks. The Nasdaq AD Volume Line also broke resistance as Net Advancing Volume surged to its highest level since early July. It is hard to ignore global breakouts on strong breadth.


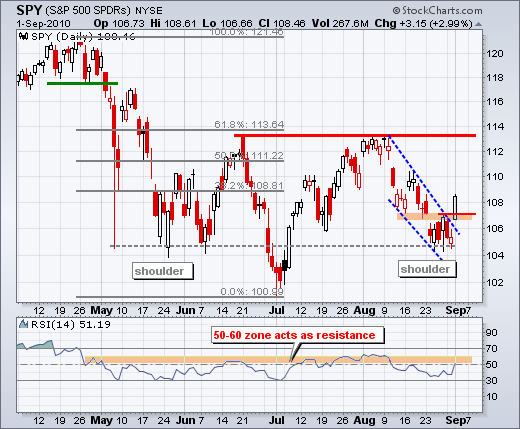
On the daily chart, SPY held support around 104-105 with a gap and surge above 108. The gap and breakout are bullish as long as they hold. With SPY reversing the August downtrend and a reaction low put in, we can entertain the idea of an inverse head-and-shoulders pattern. While the June-July highs mark the next big resistance point around 113, waiting for a break above 113 to turn bullish seems a bit late to me. At the risk of looking too far ahead, a mid September breakout could even turn into a bull trap (failed breakout). I am getting ahead of myself. At this point, I will consider Wednesday's breakout bullish until there is evidence to the contrary.
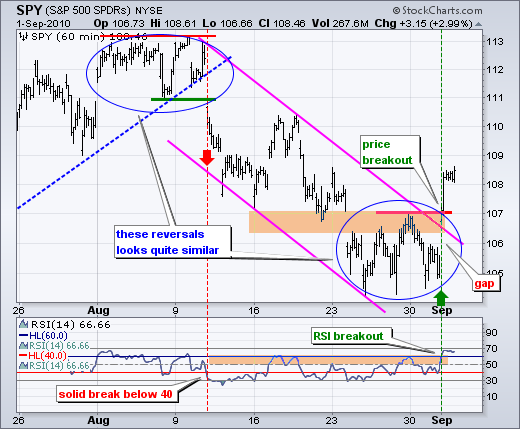
The 60-minute chart confirms the breakout. I set key short-term resistance at 107.10 and SPY broke above this level in the first 30 minutes of trading. RSI broke above 60 to turn momentum bullish. Broken resistance around 107 turns into the first support zone to watch on a pullback. A strong breakout should hold and a break back below 107 would be negative. The reversal over the last eight days looks exactly the opposite of the early August reversal (blue ovals). There was a gap down, a consolidation and then a gap up to break resistance. This is certainly not a dull market.
It is one full week on the economic reporting front. The European Central Bank makes its interest rate decision and policy statement on Thursday, which will affect the Euro. Friday is the big day with ISM Services (consensus 53) and non-farm payrolls (consensus -80,000). We can basically watch the trend for these reports as the week unfolds. Better-than-expected numbers could buoy the bulls, but worse-than-expected numbers would likely bring out the sellers as chances of a double dip increase.
Key Economic Reports:
Thu - Sep 02 - 07:45 - European Central Bank Policy Statement
Thu - Sep 02 - 08:30 - Initial Claims
Thu - Sep 02 - 10:00 - Factory Orders
Thu - Sep 02 - 10:00 - Pending Home Sales
Fri - Sep 03 - 08:30 - Employment Report
Fri - Sep 03 - 10:00 - ISM Services
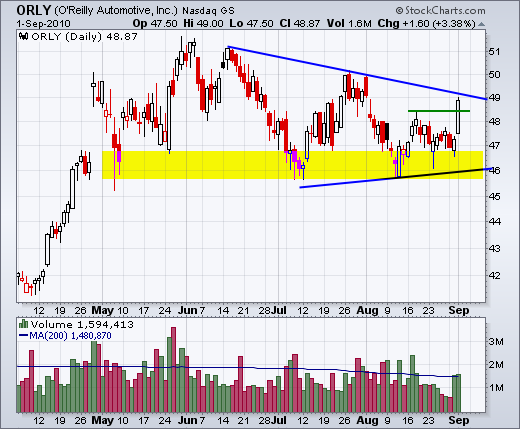
Charts of Interest: AAPL, AMZN, CEPH, FISV, ORLY
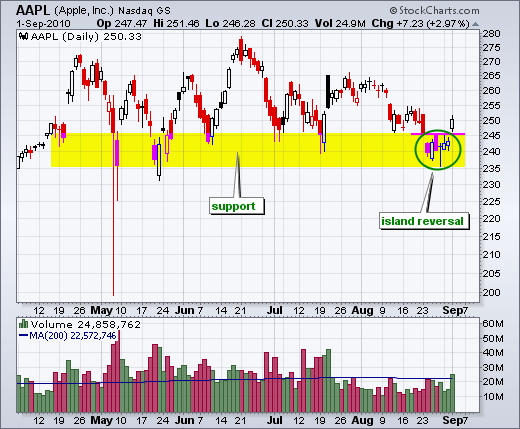
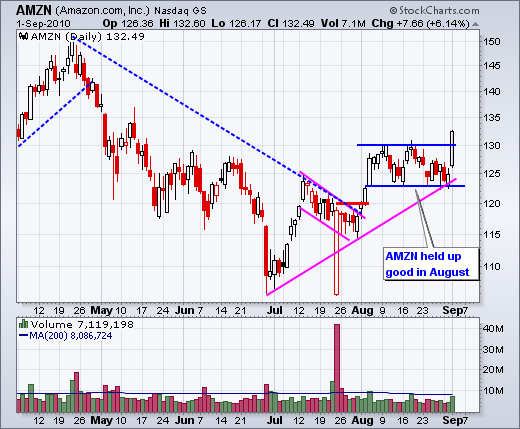
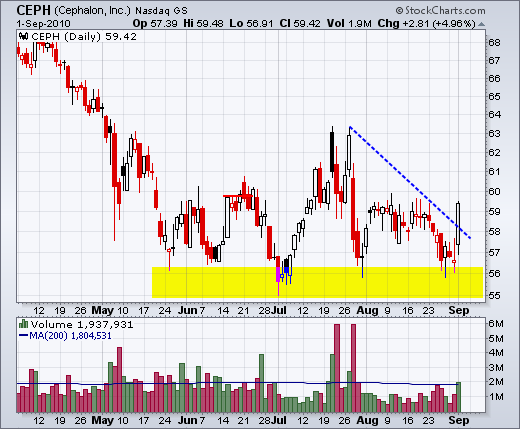
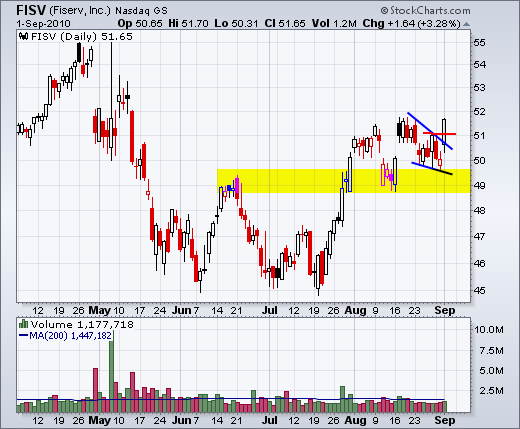
This commentary and charts-of-interest are designed to stimulate thinking. This analysis is not a recommendation to buy, sell, hold or sell short any security (stock ETF or otherwise). We all need to think for ourselves when it comes to trading our own accounts. First, it is the only way to really learn. Second, we are the only ones responsible for our decisions. Think of these charts as food for further analysis. Before making a trade, it is important to have a plan. Plan the trade and trade the plan. Among other things, this includes setting a trigger level, a target area and a stop-loss level. It is also important to plan for three possible price movements: advance, decline or sideways. Have a plan for all three scenarios BEFORE making the trade. Consider possible holding times. And finally, look at overall market conditions and sector/industry performance.

About the author:
Arthur Hill, CMT, is the Chief Technical Strategist at TrendInvestorPro.com. Focusing predominantly on US equities and ETFs, his systematic approach of identifying trend, finding signals within the trend, and setting key price levels has made him an esteemed market technician. Arthur has written articles for numerous financial publications including Barrons and Stocks & Commodities Magazine. In addition to his Chartered Market Technician (CMT) designation, he holds an MBA from the Cass Business School at City University in London.
Learn More


