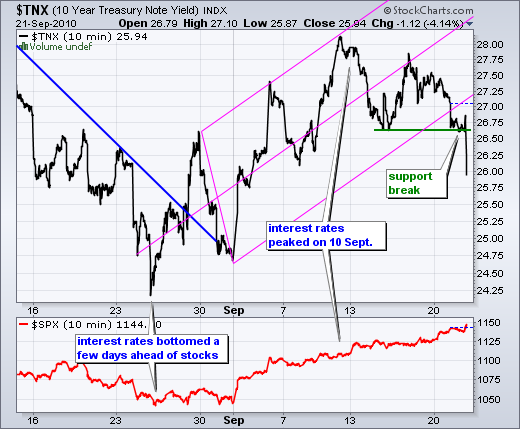
For stocks, there was good news and bad news on Tuesday. It is positive to see the Euro surging, but negative to see interest rates falling. Throughout 2010, stocks have been positively correlated with interest rates and negatively correlated with the Euro. Which relationship are we to follow here? I think the decline in interest rates holds sway here and it is negative for stocks. With the economic recovery well underway, interest rates should be rising as conditions improve. However, the Fed does not seem confident in the economy and quantitative easing is back on the table. This assessment pushed bonds sharply higher and interest rates sharply lower on Tuesday. The chart below shows the 10-year Treasury Yield ($TNX) bottoming ahead of stocks in late August and peaking on September 10th. $TNX broke support with a sharp decline today and this bodes ill for equities.


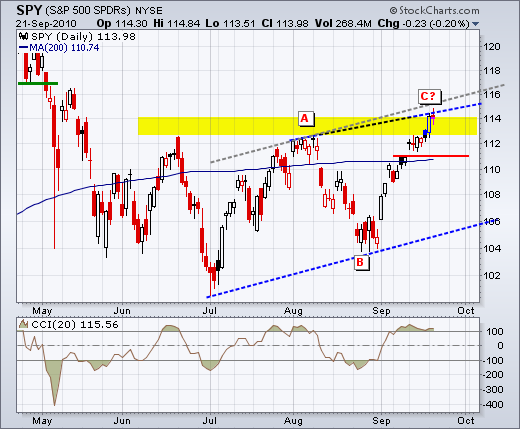
On the daily chart, SPY formed an indecisive candlestick with a stall around 114. These spinning tops can sometimes foreshadow reversals. Judging from the candlesticks, a decline below 112 would erase Monday's gain and call for a short-term trend reversal. Also notice that SPY remains in a potential reversal zone around 114-115. Resistance in this area stems from the channel trendline and the Wave C target. Also notice that SPY is overbought and ripe for a correction.

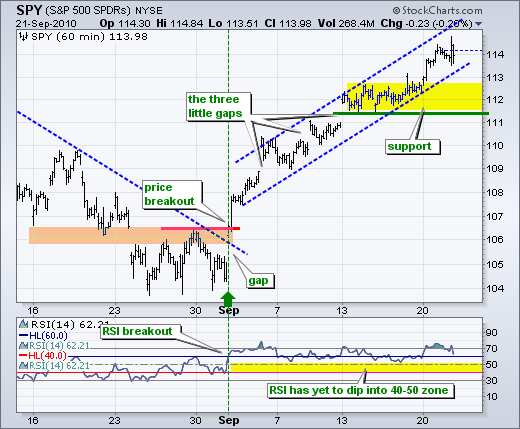
Based on the short-term candlestick assessment above, I am moving key support to 112. A tight channel has formed in September and a break below the lower trendline at 113 would be the first signal. RSI remains in bull mode with momentum support in the 40-50 zone. A break below this zone would turn RSI bearish.

Key Economic Reports:
Wed - Sep 22 - 10:30 – Oil Inventories
Thu - Sep 23 - 08:30 - Initial Claims
Thu - Sep 23 - 10:00 - Existing Home Sales
Thu - Sep 23 - 10:00 - Leading Indicators
Thu - Sep 23 - 13:00 – Volcker speaks
Fri - Sep 24 - 08:30 - Durable Orders
Fri - Sep 24 - 10:00 - New Home Sales
Fri - Sep 24 - 10:00 – Fed governors Lacker and Plosser speak
Charts of Interest: Tuesday and Thursday.
This commentary and charts-of-interest are designed to stimulate thinking. This analysis is not a recommendation to buy, sell, hold or sell short any security (stock ETF or otherwise). We all need to think for ourselves when it comes to trading our own accounts. First, it is the only way to really learn. Second, we are the only ones responsible for our decisions. Think of these charts as food for further analysis. Before making a trade, it is important to have a plan. Plan the trade and trade the plan. Among other things, this includes setting a trigger level, a target area and a stop-loss level. It is also important to plan for three possible price movements: advance, decline or sideways. Have a plan for all three scenarios BEFORE making the trade. Consider possible holding times. And finally, look at overall market conditions and sector/industry performance.

About the author:
Arthur Hill, CMT, is the Chief Technical Strategist at TrendInvestorPro.com. Focusing predominantly on US equities and ETFs, his systematic approach of identifying trend, finding signals within the trend, and setting key price levels has made him an esteemed market technician. Arthur has written articles for numerous financial publications including Barrons and Stocks & Commodities Magazine. In addition to his Chartered Market Technician (CMT) designation, he holds an MBA from the Cass Business School at City University in London.
Learn More


