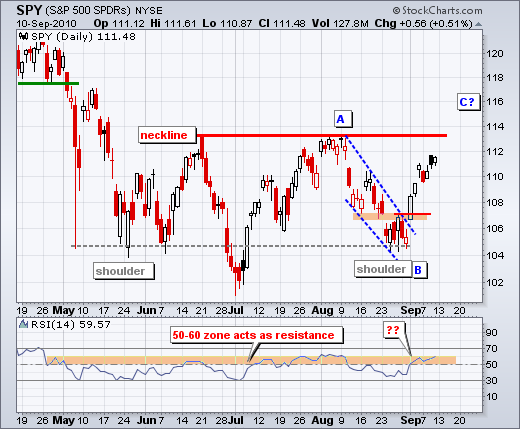
On the daily chart, SPY remains within a large consolidation with support around 104 and resistance around 113. The ETF closed at 111.48 and the futures are pointing to a little upside pop on the open. At some point, performance anxiety may enter the picture to propel the ETF above resistance. Many portfolio managers remain underinvested and there is a fair amount of cash on the sidelines. The pressure to become invested will increase as the market moves higher. Such pressure could produce a break above the June-August highs. Technically, this would confirm the inverse head-and-shoulders pattern. However, just like economics, there is always an alternative to consider. Enter Elliott Wave. It is also possible that we have an ABC correction unfolding. Under this assumption, the April-May decline started an extended downtrend and the July-Sept?? advance is just a correction within a bigger downtrend. Wave A extends to the early August high, Wave B to the late August low and Wave C is currently underway. A and C are sometimes equal, which means the target for Wave C would be to around 116-117. While a break above the June-August highs would be positive, I would not get too bullish at that stage.


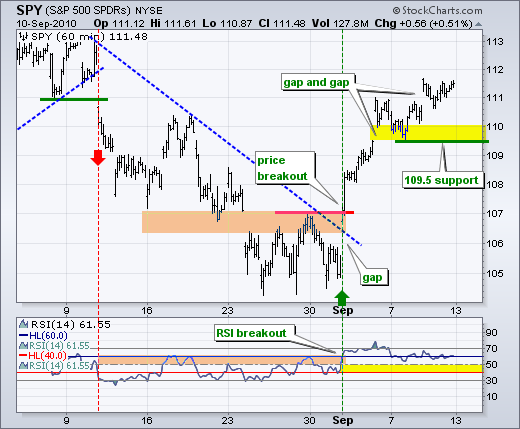
On the 60-minute chart, the gaps keep coming and the gaps keep holding. SPY gapped and broke 107 resistance with a big surge on September 1st to kick off this short-term uptrend. Gaps followed on the 3rd and the 9th. There were pullbacks after these gaps, but they held for the most part and the trend remains up. There is a support zone around 110 with key support set at 109.5 for now. Even though upside momentum has slowed, there is clearly more upside momentum than downside momentum. This means we could see 113 or higher before this up trend reverses. RSI remains in bull mode as it holds comfortably above the 40-50 zone.

Key Economic Reports:
Tue - Sep 14 - 08:30 - Retail Sales
Tue - Sep 14 - 10:00 - Business Inventories
Wed - Sep 15 - 08:30 - NY Empire Manufacturing Survey
Wed - Sep 15 - 09:15 - Industrial Production
Wed - Sep 15 - 10:30 - Oil Inventories
Thu - Sep 16 - 08:30 - Jobless Claims
Thu - Sep 16 - 08:30 - PPI
Thu - Sep 16 - 10:00 - Philadelphia Fed
Thu - Sep 16 - 16:30 - Fed Balance Sheet
Fri - Sep 17 - 08:30 - CPI
Fri - Sep 17 - 09:55 - Michigan Sentiment
Charts of Interest: Tuesday and Thursday.
This commentary and charts-of-interest are designed to stimulate thinking. This analysis is not a recommendation to buy, sell, hold or sell short any security (stock ETF or otherwise). We all need to think for ourselves when it comes to trading our own accounts. First, it is the only way to really learn. Second, we are the only ones responsible for our decisions. Think of these charts as food for further analysis. Before making a trade, it is important to have a plan. Plan the trade and trade the plan. Among other things, this includes setting a trigger level, a target area and a stop-loss level. It is also important to plan for three possible price movements: advance, decline or sideways. Have a plan for all three scenarios BEFORE making the trade. Consider possible holding times. And finally, look at overall market conditions and sector/industry performance.

About the author:
Arthur Hill, CMT, is the Chief Technical Strategist at TrendInvestorPro.com. Focusing predominantly on US equities and ETFs, his systematic approach of identifying trend, finding signals within the trend, and setting key price levels has made him an esteemed market technician. Arthur has written articles for numerous financial publications including Barrons and Stocks & Commodities Magazine. In addition to his Chartered Market Technician (CMT) designation, he holds an MBA from the Cass Business School at City University in London.
Learn More


