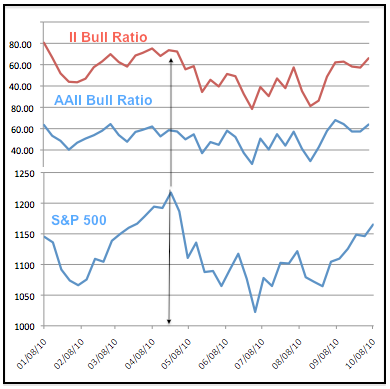
Survey data is often used to measure extremes in bullish sentiment or bearish sentiment. It is bearish when too many respondents are bullish and bullish when too many are bearish. These surveys spend most of their time between bullish and bearish extremes (i.e. without signals). The AAII survey and Investors Intelligence survey are two of the most popular sentiment indicators. AAII surveys individual investors (retail crowd), while Investors Intelligence surveys newsletter writers ("professionals). The AAII bull ratio finished at .64 last week. The bull ratio equals percent bulls divided by percent bulls plus percent bears. Percent neutral is excluded from this formula. This is the third reading above .60 in the last four weeks. The indicator last surpassed .60 in early April and this preceded the peak later that month. The Investors Intelligence bull/bear ratio is trading above .60 and at its highest level since May. While this level may seem relatively high, it is still well below the peak seen in April (75.4). Admittedly, sentiment indicators are not ideal for timing. However, the sentiment extreme in the AAII bull ratio suggests that the move is growing mature and the odds of a correction are increasing. The chart below was created in excel.
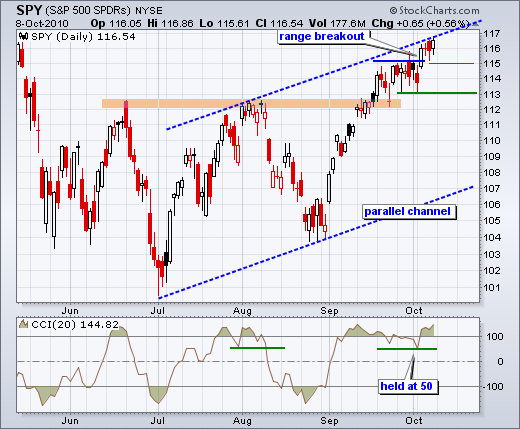
On the daily chart, SPY is up around 12% from its late August low. This 6-week run started with a higher low and carried the ETF above the early August high. A clear zigzag higher defines the overall uptrend. Even though the trend is clearly up, the ETF is still overextended on the upside because we have yet to see a pullback. Picking resistance is difficult with such a strong uptrend, but it is possible that the upper trendline of a rising price channel marks some resistance around 117. Even with potential resistance and slowing momentum, the overall trend remains up with no signs of weakness. I am marking daily chart support at 113 and CCI support at 50.

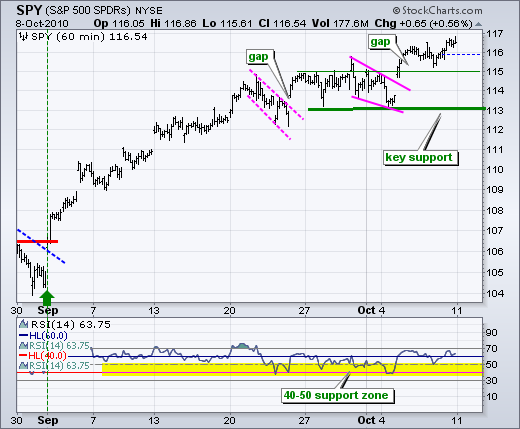
The 60-minute chart shows two distinct periods for this advance. SPY moved from 104 to 113 (+9.1%) the first three weeks and from 113 to 116.5 (3.1%) the second three weeks. Upside momentum has slowed significantly the last three weeks as the ETF formed a rising channel. Despite slowing momentum, SPY continues to trace out a series of higher highs and higher lows. A move below the channel trendline and the last reaction low at 113 would fully reverse this uptrend. RSI support remains in the 40-50 zone and a move below 40 would turn momentum bearish. Those looking for an early sign can turn to broken resistance around 115, which turns into the first support level.

Today is a partial holiday. The stock market is open, but the bond market, government offices and most banks will be closed. This means that volume is likely to be below average.
Key Economic Reports:
Oct 11 – 08:30 – Bond Market Closed, Stock Markets Open
Oct 12 - 14:00 - September FOMC Minutes
Oct 13 - 07:00 - MBA Mortgage Applications
Oct 13 - 10:30 - Oil Inventories
Oct 14 - 08:30 - Jobless Claims
Oct 14 - 08:30 - PPI
Oct 15 - 08:15 - Ben Bernanke Speaks
Oct 15 - 08:30 - CPI
Oct 15 - 08:30 - Retail Sales
Oct 15 - 08:30 - NY Fed Empire Manufacturing Survey
Oct 15 - 09:55 - Michigan Sentiment
Charts of Interest: Tuesday and Thursday.
-----------------------------------------------------------------------------
This commentary and charts-of-interest are designed to stimulate thinking. This analysis is not a recommendation to buy, sell, hold or sell short any security (stock ETF or otherwise). We all need to think for ourselves when it comes to trading our own accounts. First, it is the only way to really learn. Second, we are the only ones responsible for our decisions. Think of these charts as food for further analysis. Before making a trade, it is important to have a plan. Plan the trade and trade the plan. Among other things, this includes setting a trigger level, a target area and a stop-loss level. It is also important to plan for three possible price movements: advance, decline or sideways. Have a plan for all three scenarios BEFORE making the trade. Consider possible holding times. And finally, look at overall market conditions and sector/industry performance.

