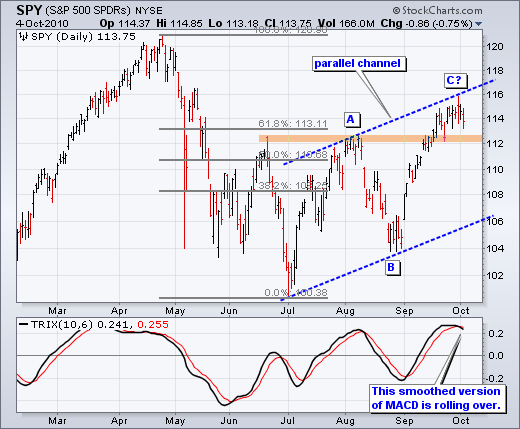
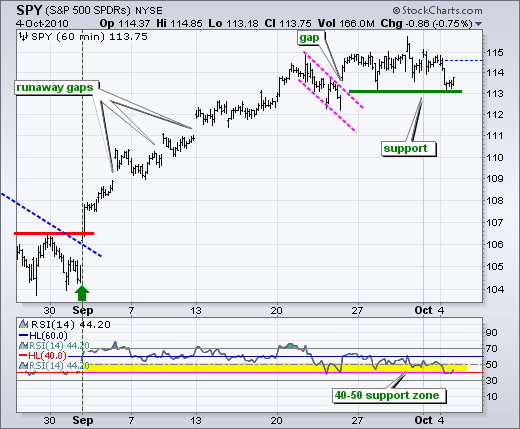
There is no change in the daily chart analysis. An ABC correction could be taking shape, but there is no confirmation because the short-term trend remains up. A short-term trend reversal is needed for the earliest possible indication that a bigger decline is starting. On the 60-minute chart, SPY is testing short-term support after a modest decline on Monday. Even though the ETF has traded flat the last two weeks, the overall trend remains up in the absence of an actual breakdown. An uptrend plus a trading range still favors the bulls. The flag gap/breakout and last week's lows combine to mark support in the 113 area. SPY declined to this area early Monday and then stalled the rest of the day. Also notice that RSI declined to its support zone and firmed. This is the spot for short-term bottom pickers. A break below 113 in SPY and 40 in RSI would reverse the short-term uptrend and make the bigger ABC pattern possible.

It is another big week on the economic front. ISM Services will be reported on Tuesday morning. We also get a couple of peaks at the employment picture with the ADP report on Wednesday and Jobless Claims on Thursday. Friday, of course, is the granddaddy of them all.
Key Economic Reports:
Mon - Oct 04 - 10:00 - Factory Orders
Mon - Oct 04 - 10:00 - Pending Home Sales
Tue - Oct 05 - 10:00 - ISM Services
Wed - Oct 06 - 07:00 - MBA Mortgage Application
Wed - Oct 06 - 08:15 - ADP Employment Change
Wed - Oct 06 - 10:30 - Oil Inventories
Thu - Oct 07 - 07:00 – Bank of England Policy Statement
Thu - Oct 07 - 07:45 – European Central Bank Policy Statement
Thu - Oct 07 - 08:30 - Jobless Claims
Fri - Oct 08 - 08:30 – Employment Report
Charts of Interest: Separate post.
-----------------------------------------------------------------------------
This commentary and charts-of-interest are designed to stimulate thinking. This analysis is not a recommendation to buy, sell, hold or sell short any security (stock ETF or otherwise). We all need to think for ourselves when it comes to trading our own accounts. First, it is the only way to really learn. Second, we are the only ones responsible for our decisions. Think of these charts as food for further analysis. Before making a trade, it is important to have a plan. Plan the trade and trade the plan. Among other things, this includes setting a trigger level, a target area and a stop-loss level. It is also important to plan for three possible price movements: advance, decline or sideways. Have a plan for all three scenarios BEFORE making the trade. Consider possible holding times. And finally, look at overall market conditions and sector/industry performance.


