First note that I will be travelling on Tuesday and will not be able to write a commentary that day. The next commentary will be Wednesday morning. It is just as well because the markets will digest the week's first big event on Wednesday morning. The elections are Tuesday and the market will react to the results with Wednesday's open. There will not be too much time for reaction because the market will then move into Fed mode. A FOMC policy statement on QE2 is expected on Wednesday afternoon. Barring a surprise, the election results and Fed news are already priced into the market. That does not mean there will not be a reaction. As noted last week, we could see a buy-the-rumor and sell-the-news scenario unfold. The market has been rising to price in this news and may just sell-off once these events come to pass. At this point, the best we can do is stick the charts.
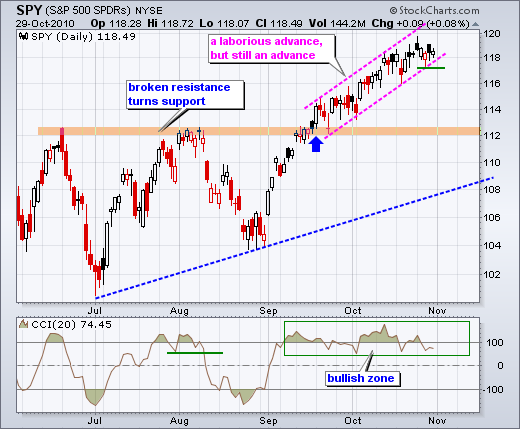
There is no change on the daily chart. Even though the advance has grown laborious, SPY remains in an uptrend. The surge above 114 on September 20th marked the easy part of the advance. Since this surge, SPY has worked its way higher within a rising price channel. Many indecisive candlesticks formed, but the uptrend was never reversed with a downside move. A break below channel support at 117 would argue for a pullback towards broken resistance around 112. CCI remains in its bull zone and has yet to break 50 to signal weakness in momentum.

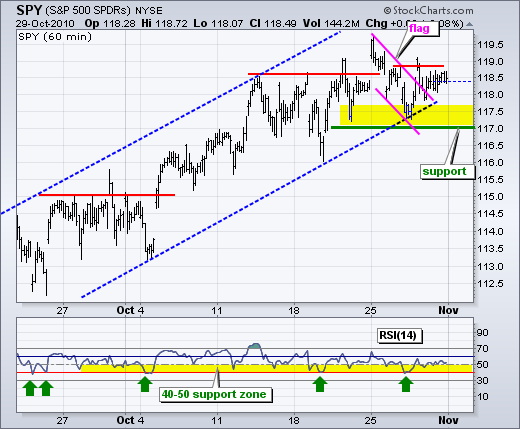
On the 60-minute chart, SPY bounced off channel support and RSI bounced off 40 to keep the uptrend alive. Last week's decline looks like a falling flag, which is a bullish corrective pattern. SPY broke flag resistance with a surge on Thursday, but quickly fell back into a right range that extended until the end of the week. Technically, the flag breakout is holding and remains bullish until proven otherwise. A convincing trend reversal will not occur until RSI breaks 40 AND SPY breaks below 117.

Key Economic Reports:
Mon - Nov 01 - 08:30 – Bernanke speaks
Mon - Nov 01 - 08:30 - Personal Income and Spending
Mon - Nov 01 - 10:00 - ISM Index
Mon - Nov 01 - 10:00 - Construction Spending
Tue - Nov 02 – 00:00 – Mid-Term Elections
Wed - Nov 03 - 07:00 - MBA Mortgage Applications
Wed - Nov 03 - 10:00 - ISM Services
Wed - Nov 03 - 10:00 - Factory Orders
Wed - Nov 03 - 10:30 - Crude Inventories
Wed - Nov 03 - 14:00 - Auto-Truck Sales
Wed - Nov 03 - 14:15 - FOMC Rate Decision
Thu - Nov 04 - 08:30 - Initial Claims
Fri - Nov 05 - 08:30 - Employment Report
Fri - Nov 05 - 10:00 - Pending Home Sales
Charts: Tuesday and Thursday in separate post.
-----------------------------------------------------------------------------
This commentary and charts-of-interest are designed to stimulate thinking. This analysis is not a recommendation to buy, sell, hold or sell short any security (stock ETF or otherwise). We all need to think for ourselves when it comes to trading our own accounts. First, it is the only way to really learn. Second, we are the only ones responsible for our decisions. Think of these charts as food for further analysis. Before making a trade, it is important to have a plan. Plan the trade and trade the plan. Among other things, this includes setting a trigger level, a target area and a stop-loss level. It is also important to plan for three possible price movements: advance, decline or sideways. Have a plan for all three scenarios BEFORE making the trade. Consider possible holding times. And finally, look at overall market conditions and sector/industry performance.
