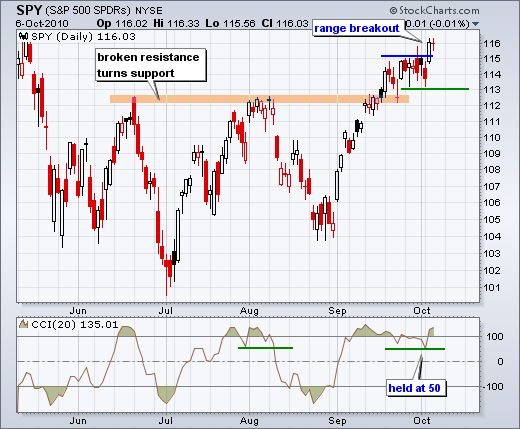
On the daily chart, SPY broke above range resistance with a gap and long white candlestick on Tuesday. These developments affirmed the medium-term uptrend and reinforced short-term support around 113. The bulls are on firm footing as long as this breakout holds. I still have the ABC correction in the back of my mind, but will not bring it to the forefront as long as the ETF holds above 113. Doji signal indecision, however, a little indecision is okay after a big move. What happens after the doji is more important.
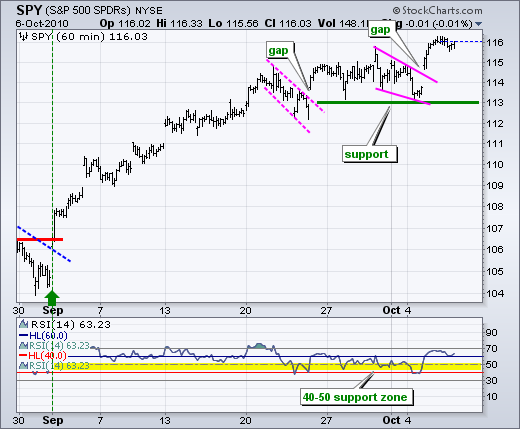
The 60-minute chart reinforces the short-term assessment noted above. SPY broke flag/wedge resistance with a gap and this gap is holding. The gap/breakout remains bullish until proven otherwise. A move into the gap zone around 114 would make the bulls nervous, but it would take a break below support at 113 to actually reverse this short-term uptrend.

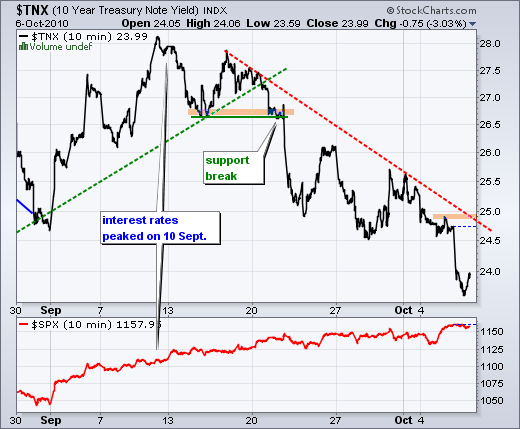
The Euro is doing its part in facilitating the risk-on trade, but bonds have been moving higher since 10-September. This means rates have been moving lower. A decline in rates corresponds with economic weakness. However, stocks are strong and this bodes well for the economy. Perhaps bonds are rising in anticipation of QE2. Regardless, it seems to me that something has to give sooner rather than later. I wonder how long both bonds and stocks can continue to rise.

Key Economic Reports:
Wed - Oct 06 - 07:00 - MBA Mortgage Application
Wed - Oct 06 - 08:15 - ADP Employment Change
Wed - Oct 06 - 10:30 - Oil Inventories
Thu - Oct 07 - 07:00 – Bank of England Policy Statement
Thu - Oct 07 - 07:45 – European Central Bank Policy Statement
Thu - Oct 07 - 08:30 - Jobless Claims
Fri - Oct 08 - 08:30 – Employment Report
Charts of Interest: Separate Post.
-----------------------------------------------------------------------------
This commentary and charts-of-interest are designed to stimulate thinking. This analysis is not a recommendation to buy, sell, hold or sell short any security (stock ETF or otherwise). We all need to think for ourselves when it comes to trading our own accounts. First, it is the only way to really learn. Second, we are the only ones responsible for our decisions. Think of these charts as food for further analysis. Before making a trade, it is important to have a plan. Plan the trade and trade the plan. Among other things, this includes setting a trigger level, a target area and a stop-loss level. It is also important to plan for three possible price movements: advance, decline or sideways. Have a plan for all three scenarios BEFORE making the trade. Consider possible holding times. And finally, look at overall market conditions and sector/industry performance.


