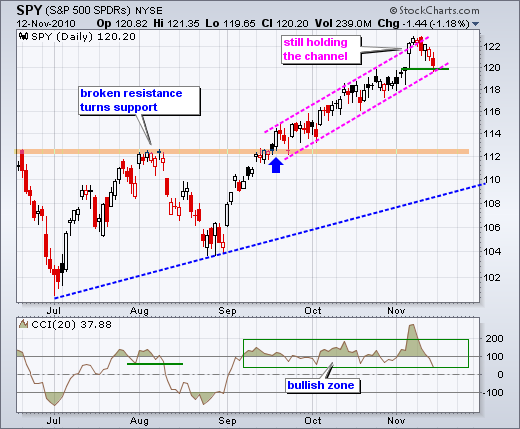
The Euro and US Treasuries are moving lower, which means the Dollar and US interest rates are moving higher. With these negatives weighing on the stock market, SPY declined around 2% last week. This was the biggest weekly decline since early August. On the daily chart, the ETF fell to the lower trendline of the rising channel for its first support test. Also notice that CCI declined below 50 for the first time since early September. Stocks were overdue for a corrective period and it looks like one could be unfolding now. Even if SPY breaks support at 120 and CCI turns negative, I would not be surprised to see a bounce after the first decent pullback. SPY could break support, decline to 118-119 and then bounce back to 120-121 before continuing lower.
Signs of a short-term trend reversal are starting to appear on the 60-minute chart. SPY filled the gap with a decline below 120 last week. The break below 120 did not last long as the ETF bounced back above this key level late Friday. The channel trendline and broken resistance confirm support in this area. RSI broke below 40 and reached 30 for the first time since August. While 30 is considered oversold, I prefer to view this as a sign of weakness. It takes strong selling pressure to become oversold. Also notice that RSI clearly broke its bull zone (40-80) for the first time since the rally began in early September.

Key Economic Reports:
Nov 15 - 08:30 - Retail Sales
Nov 15 - 08:30 - Empire Manufacturing Index
Nov 16 - 08:30 - PPI
Nov 16 - 09:15 - Industrial Production
Nov 16 - 10:00 - NAHB Market Housing Index
Nov 17 - 07:00 - MBA Mortgage Applications
Nov 17 - 08:30 - CPI
Nov 17 - 08:30 - Housing Starts/Building Permits
Nov 17 - 08:30 - Oil Inventories
Nov 18 - 08:30 - Jobless Claims
Nov 18 - 10:00 - Leading Indicators
Nov 18 - 10:00 - Philadelphia Fed Survey
Charts: Tuesday and Thursday in separate post.
-----------------------------------------------------------------------------
This commentary and charts-of-interest are designed to stimulate thinking. This analysis is not a recommendation to buy, sell, hold or sell short any security (stock ETF or otherwise). We all need to think for ourselves when it comes to trading our own accounts. First, it is the only way to really learn. Second, we are the only ones responsible for our decisions. Think of these charts as food for further analysis. Before making a trade, it is important to have a plan. Plan the trade and trade the plan. Among other things, this includes setting a trigger level, a target area and a stop-loss level. It is also important to plan for three possible price movements: advance, decline or sideways. Have a plan for all three scenarios BEFORE making the trade. Consider possible holding times. And finally, look at overall market conditions and sector/industry performance.


