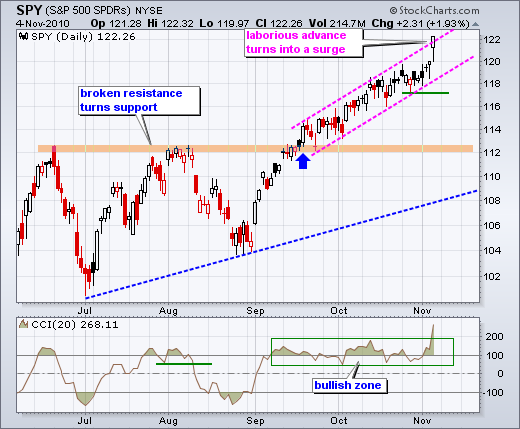
Stocks started the week strong and surged on Thursday with big gains in all major indices. All sectors were up with materials, energy, and finance leading the charge. These three were up over 3%. It is positive to see relative strength coming from the finance sector. On the daily SPY chart, the ETF surged above the upper trendline of a rising price channel. Such strength clearly keeps the long-term uptrend in play, but it also increases of the chances for a pullback back into the channel.
A slightly different channel is visible on the 60-minute chart. I drew the lower trendline first and the upper trendline is parallel. Based on this extension, SPY has a little more room to run, but not much before becoming overbought. Key support remains in the 118 area. Broken resistance around 119.6-119.8 turns into another support zone to watch on any pullback.

Key Economic Reports:
Fri - Nov 05 - 08:30 - Employment Report
Fri - Nov 05 - 10:00 - Pending Home Sales
Charts: Tuesday and Thursday in separate post.
-----------------------------------------------------------------------------
This commentary and charts-of-interest are designed to stimulate thinking. This analysis is not a recommendation to buy, sell, hold or sell short any security (stock ETF or otherwise). We all need to think for ourselves when it comes to trading our own accounts. First, it is the only way to really learn. Second, we are the only ones responsible for our decisions. Think of these charts as food for further analysis. Before making a trade, it is important to have a plan. Plan the trade and trade the plan. Among other things, this includes setting a trigger level, a target area and a stop-loss level. It is also important to plan for three possible price movements: advance, decline or sideways. Have a plan for all three scenarios BEFORE making the trade. Consider possible holding times. And finally, look at overall market conditions and sector/industry performance.


