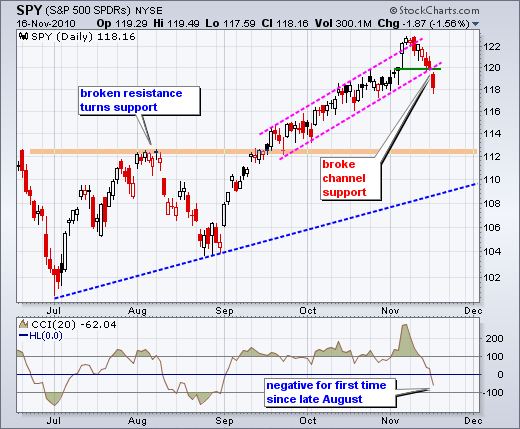
With a sharp decline on Tuesday, the bulk of the short-term evidence has turned bearish. First, three of the four short-term breadth indicators moved into bear mode. These were featured in Monday's commentary. Second, RSI on the 60-minute chart broke below 40 last week and CCI on the daily chart turned negative on Tuesday. Third, SPY broke channel support on the daily chart and key support on the 60-minute chart. The plunge in global stock markets pushed money into the US Treasuries (flight to safety). The chart below shows SPY breaking below channel support with a sharp decline (3.72%) the last seven days. This reverses the short-term uptrend to signal the start of a correction within the medium-term uptrend. There are two types of corrections. Securities can either move into a trading range or retrace a portion of the prior advance. A trading range could find support sooner rather than later. For a retracement, broken resistance turns into support around 112. Also notice that a 50-62% retracement of the Aug-Nov advance would extend to this area.
On the 60-minute chart, SPY had a chance to hold support with a bullish flag taking shape, but did not. Instead, SPY broke support with a gap down and decline below 119.50 on Tuesday. This reverses the uptrend that was in place since the September 1st breakout. Despite this short-term trend reversal, the ETF is getting short-term oversold already. Moreover, this sharp dip could entice under-invested portfolio managers. I am marking resistance around 121 for now. RSI resistance is set in the 50-60 zone. A weak oversold bounce to these areas could provide a second chance to partake in the short-term downtrend.

Key Economic Reports:
Nov 17 - 07:00 - MBA Mortgage Applications
Nov 17 - 08:30 - CPI
Nov 17 - 08:30 - Housing Starts/Building Permits
Nov 17 - 08:30 - Oil Inventories
Nov 18 - 08:30 - Jobless Claims
Nov 18 - 10:00 - Leading Indicators
Nov 18 - 10:00 - Philadelphia Fed Survey
Charts: Tuesday and Thursday in separate post.
-----------------------------------------------------------------------------
This commentary and charts-of-interest are designed to stimulate thinking. This analysis is not a recommendation to buy, sell, hold or sell short any security (stock ETF or otherwise). We all need to think for ourselves when it comes to trading our own accounts. First, it is the only way to really learn. Second, we are the only ones responsible for our decisions. Think of these charts as food for further analysis. Before making a trade, it is important to have a plan. Plan the trade and trade the plan. Among other things, this includes setting a trigger level, a target area and a stop-loss level. It is also important to plan for three possible price movements: advance, decline or sideways. Have a plan for all three scenarios BEFORE making the trade. Consider possible holding times. And finally, look at overall market conditions and sector/industry performance.


