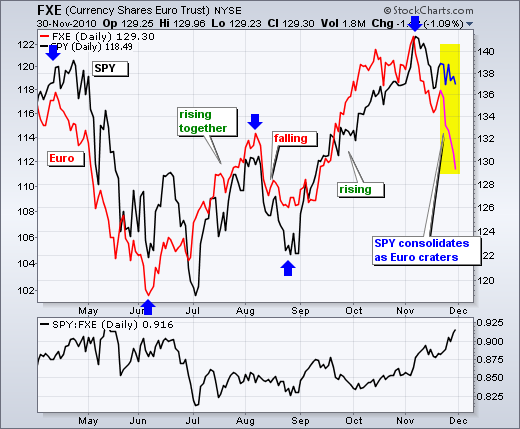
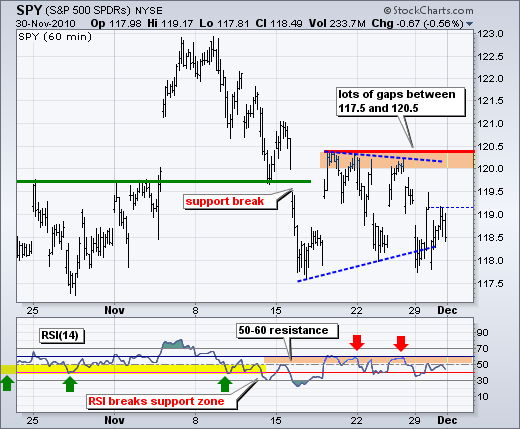
It is as if the under-invested fund managers can smell the yearend. SPY gapped down and moved below 118 yet again on Tuesday, but the bulls pushed the ETF back above 119 in the afternoon. Even though SPY managed to fill the gap, it did not break above yesterday's high, which now becomes the first resistance level to watch (see 60-minute chart below). Overall, the short-term evidence still favors the bears. SPY broke support in mid November and has yet to prove this break otherwise with a resistance break. CCI remains in negative territory on the daily chart and RSI remains below 60 on the 60-minute chart. Short-term breadth indicators turned bearish in mid November and remain in bear mode. Despite this bearish evidence and severe weakness in the Euro, stocks are holding up quite well as DIA and SPY continue to hold support from their November lows. IWM and QQQQ are trading well above their November lows. An oversold bounce in the Euro could give way to a rally in stocks. Today is a big day on the economic front with lots of reports. Also note that the employment report is due Friday.

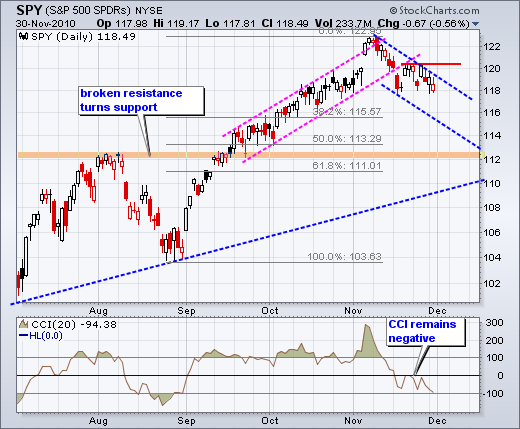
There is no change on the daily chart. SPY broke channel support with a gap down in mid November and this break is holding. This short-term support break started a short-term downtrend that is considered a correction within the bigger uptrend. As far as downside targets, we can draw a falling price channel and extend the lower trendline. Also note the 38% retracement around 115.57. CCI continues to hit resistance at zero. A break into positive territory is needed to put momentum back with the bulls.

On the 60-minute chart, SPY has gapped up or down numerous times since the mid November support break. Despite these spirited moves in early trading, the ETF has not been able to follow through and remains range bound the last 2-3 weeks. Even though the early break below triangle support (118) did not hold, the bears still have a short-term edge. First, the mid November support break has yet to be countered with a resistance break at 120.50. Second, short-term breadth remains bearish. Third, RSI continues to hit resistance in the 50-60 zone.

Key Economic Reports:
Wed - Dec 01 - 07:00 - MBA Mortgage Applications
Wed - Dec 01 - 10:00 - ISM Index
Wed - Dec 01 - 10:00 - Construction Spending
Wed - Dec 01 - 10:30 - Crude Inventories
Wed - Dec 01 - 14:00 - Auto/Truck Sales
Wed - Dec 01 - 14:00 - Beige Book
Thu - Dec 02 - 08:30 - Jobless Claims
Thu – Dec 02 - 10:00 - Pending Home Sales
Fri – Dec 03 - 08:30 - Employment Report
Fri - Dec 03 - 10:00 - Factory Orders
Fri - Dec 03 - 10:00 - ISM Services
Charts: Tuesday and Thursday in separate post.
-----------------------------------------------------------------------------
This commentary and charts-of-interest are designed to stimulate thinking. This analysis is not a recommendation to buy, sell, hold or sell short any security (stock ETF or otherwise). We all need to think for ourselves when it comes to trading our own accounts. First, it is the only way to really learn. Second, we are the only ones responsible for our decisions. Think of these charts as food for further analysis. Before making a trade, it is important to have a plan. Plan the trade and trade the plan. Among other things, this includes setting a trigger level, a target area and a stop-loss level. It is also important to plan for three possible price movements: advance, decline or sideways. Have a plan for all three scenarios BEFORE making the trade. Consider possible holding times. And finally, look at overall market conditions and sector/industry performance.


