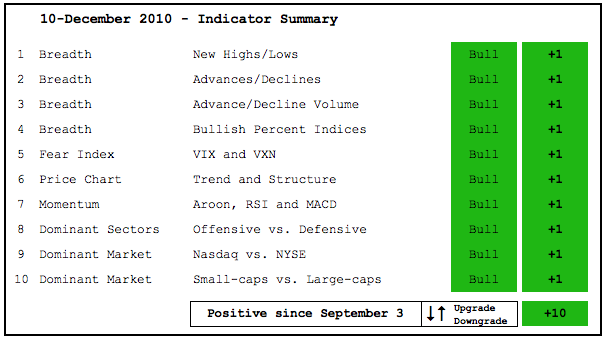
There is no change in the indicator summary. Stocks held their gains this week and there was not much movement. Led by strength in the finance sector, the NYSE AD Volume Line moved above its November high. The November lows mark key support for the AD Lines and AD Volume Lines. Net New Highs remain strong and the Cumulative Net New Highs lines are in firm uptrends. Small-caps and mid-caps are leading this advance. It looks like the appetite for risk is heating up. Please see the About Page for details on the commentaries and charts provided in Art's Charts.
- AD Lines: Bullish. The Nasdaq AD Line rebounded to establish support with the November lows. The NYSE AD Line remains in a clear uptrend.
- AD Volume Lines: Bullish. The Nasdaq and NYSE AD Volume Lines remain in uptrends with support from the November lows. The NYSE AD Volume Line exceeded its November high with help from the finance sector.
- Net New Highs: Bullish. Nasdaq and NYSE Net New Highs dipped into negative territory in mid November, but the Cumulative Net New Highs lines never turned lower and remain above their 10-day EMAs.
- Bullish Percent Indices: Bullish. All Bullish Percent Indices are above 50%.
- VIX/VXN: Bullish. The S&P 500 Volatility Index ($VIX) hit a new low and the Nasdaq 100 Volatility Index ($VXN) broke below its late November low. Falling volatility means lower risk and this is positive for stocks.
- Trend Structure: Bullish. QQQQ, IWM, SPY and MDY moved above their November highs to forge 52-week highs. DIA is dragging its feat a bit, but the trends are clearly up.
- SPY Momentum: Bullish. MACD(5,35,5) remains in positive territory. RSI bounced off the 40-50 support zone and is back above 50. The Aroon Oscillator moved into negative territory in late November, but rebounded back above +50.
- Offensive Sector Performance: Bullish. The finance sector turned sharply higher this week, but the industrials and consumer discretionary moved lower. The latter two remain strong overall and the offensive sectors continue to show upside leadership.
- Nasdaq Performance: Bullish. The $COMPQ:$NYA ratio moved to a new high in late November and remains in an uptrend.
- Small-cap Performance: Bullish. The $RUT:$OEX ratio also moved to a new high in late November and small-caps are showing relative strength.
- Breadth Charts (here) and Inter-market charts (here) have been updated
This table is designed to offer an objective look at current market conditions. It does not aim to pick tops or bottoms. Instead, it seeks to identify noticeable shifts in buying and selling pressure. With 10 indicator groups, the medium-term evidence is unlikely to change drastically overnight. Previous turns include: Positive on 11-Sept. Negative on 5-February. Positive on 5-March. Negative on 11-June. Positive on 18-June. Negative on 24-June. Positive on August 6. Negative on August 13. Positive on September 3.


