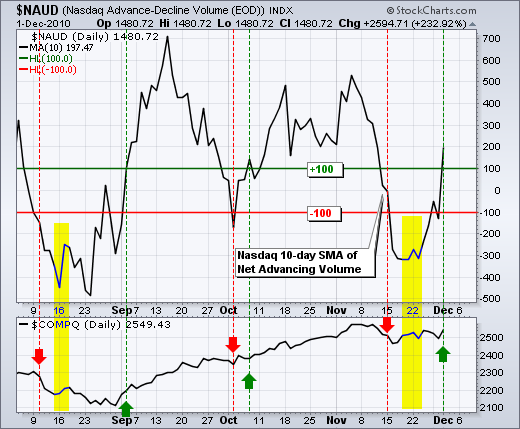
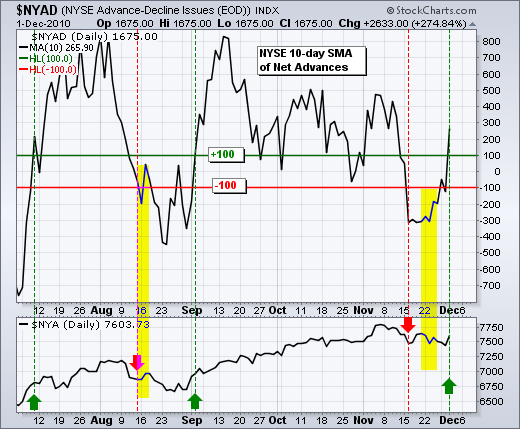
A little bounce in the Euro, some positive economic news and bullish seasonal patterns pushed stocks sharply higher on Wednesday. Historically, December is the second strongest month of the year for stocks. This historic tendency got off to a good start with yesterday's big surge. This is interesting because it is usually the second half of December that favors the bulls. The rally was broad with all four short-term breadth indicators surging above +100. These indicators are the 10—day SMAs for Net Advances and Net Advancing Volume on the NYSE and Nasdaq. SPY confirmed these breadth signals with a break above resistance. Momentum also turned bullish as CCI moved into positive territory and RSI broke above 60. As noted with the mid November bearish signal, we never know how long a signal will last or if it will result in a whipsaw (loss). We can, however, identify what it would take to negate a signal. For breadth, it would take a plunge below -100 to turn bearish again.

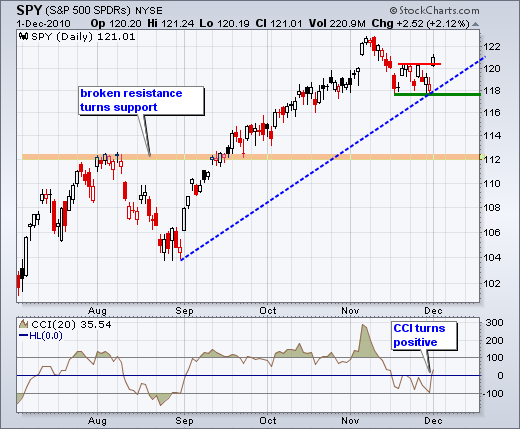
On the daily chart, SPY held support around 118 and surged above consolidation resistance with a gap. The medium-term trend was never in jeopardy with the November decline. Wednesday's gap and breakout reversed the short-term downtrend and both trends are now up again. The November lows mark key support on the daily chart. CCI moved above zero to turn short-term momentum bullish again.

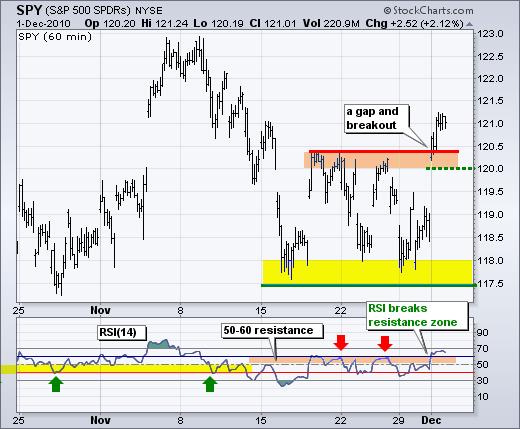
On the 60-minute chart, SPY continued its string of gaps with the biggest gap in the last three weeks. The broken resistance zone around 120-120.5 turns into the first support zone to watch for signs of weakness (cold feet). A truly strong breakout should hold and a move back below 120 would increase the chances of a breakout failure. At this point, I will set key support at 117.5, which is based on the November lows. RSI broke above the 50-60 zone to turn momentum bullish. At this point, the 40-50 zone should act as support. A move below 40 would suggest underlying weakness.

Key Economic Reports:
Thu - Dec 02 - 08:30 - Jobless Claims
Thu – Dec 02 - 10:00 - Pending Home Sales
Fri – Dec 03 - 08:30 - Employment Report
Fri - Dec 03 - 10:00 - Factory Orders
Fri - Dec 03 - 10:00 - ISM Services
Charts: Tuesday and Thursday in separate post.
-----------------------------------------------------------------------------
This commentary and charts-of-interest are designed to stimulate thinking. This analysis is not a recommendation to buy, sell, hold or sell short any security (stock ETF or otherwise). We all need to think for ourselves when it comes to trading our own accounts. First, it is the only way to really learn. Second, we are the only ones responsible for our decisions. Think of these charts as food for further analysis. Before making a trade, it is important to have a plan. Plan the trade and trade the plan. Among other things, this includes setting a trigger level, a target area and a stop-loss level. It is also important to plan for three possible price movements: advance, decline or sideways. Have a plan for all three scenarios BEFORE making the trade. Consider possible holding times. And finally, look at overall market conditions and sector/industry performance.


