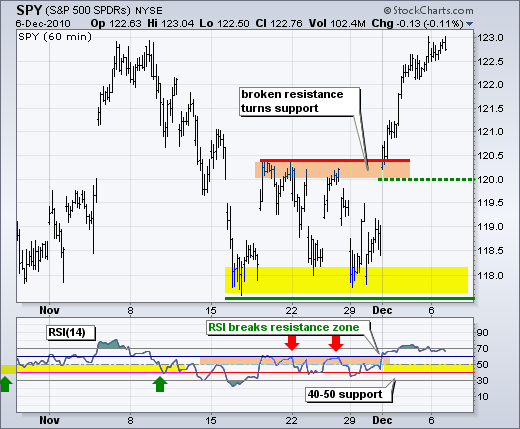
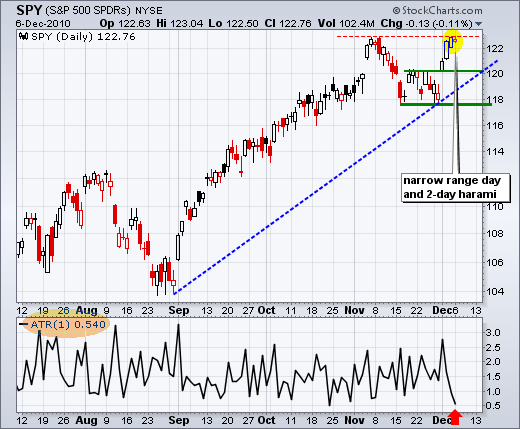
On the daily chart, SPY formed a very small candlestick with the narrowest range in over a week. The most popular narrow range indicators are NR-4 and NR-7, which refer to the narrowest high-low range in four or seven days. A narrow range shows indecision that can sometimes foreshadow a short-term reversal. The indicator window shows 1-day Average True Range (ATR), which provides a good yardstick for narrow range days. A 1-period ATR equals the True Range (TR) for the current period. TR is the greater of: (High minus Low) or (Prior Close minus Low). Think of True Range as the Wells Wilder method for measuring the current range. As you can see from the indicator, ATR(1) moved to .54, its lowest level since October 22nd. Also note that SPY is short-term overbought, at potential resistance from the November high and has a harami over the last two days. While the evidence is building for a pullback or consolidation, seasonal patterns and performance anxiety could keep pullbacks limited until yearend. Broken resistance around 120-120.5 marks the first support level to watch. The 60-minute chart expands on this first support zone. You can read more on ATR in our ChartSchool article.

I would like to welcome new readers to Art's Charts. Please see the "About" link on the right navigation bar for details on these commentaries. Questions and comments are welcome. Note that I cannot personally respond to all questions. Many times issues are dealt with in a future commentary so other users can benefit. Before submitting a question or comment, please allow some time (a few weeks) to familiarize yourself with these commentaries.
Key Economic Reports:
Tue - Dec 07 - 09:00 – Bank of Canada Policy Statement
Wed - Dec 08 - 07:00 - MBA Mortgage Applications
Wed - Dec 08 - 10:30 - Crude Inventories
Wed - Dec 09 - 08:30 – Bank of England Policy Statement
Thu - Dec 09 - 08:30 - Initial Claims
Thu - Dec 09 - 08:30 - Continuing Claims
Thu - Dec 10 - 08:30 - Trade Balance
Fri - Dec 10 - 09:55 - Michigan Sentiment
Charts of Interest: Tuesday and Thursday in separate post.
-----------------------------------------------------------------------------
This commentary and charts-of-interest are designed to stimulate thinking. This analysis is not a recommendation to buy, sell, hold or sell short any security (stock ETF or otherwise). We all need to think for ourselves when it comes to trading our own accounts. First, it is the only way to really learn. Second, we are the only ones responsible for our decisions. Think of these charts as food for further analysis. Before making a trade, it is important to have a plan. Plan the trade and trade the plan. Among other things, this includes setting a trigger level, a target area and a stop-loss level. It is also important to plan for three possible price movements: advance, decline or sideways. Have a plan for all three scenarios BEFORE making the trade. Consider possible holding times. And finally, look at overall market conditions and sector/industry performance.


