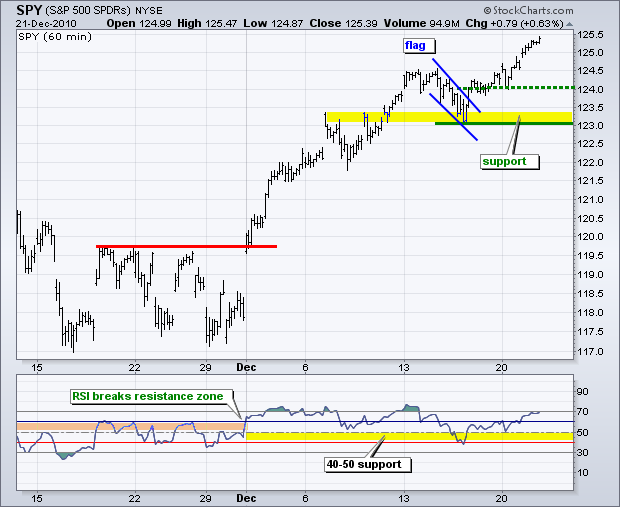
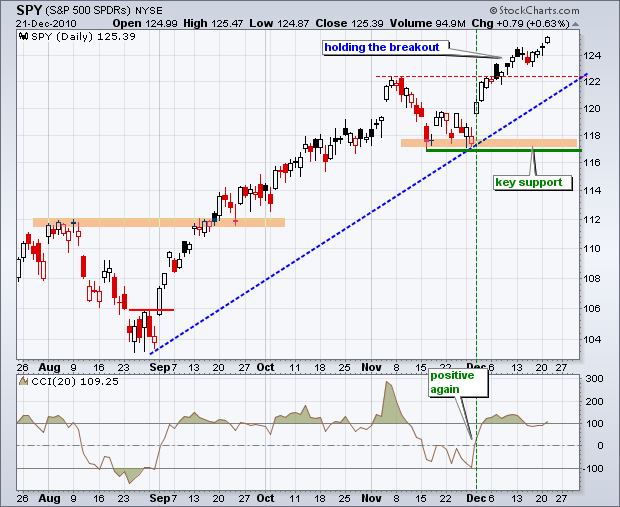
The uptrend and Santa Claus rally propelled the S&P 500 ETF (SPY) to a new high for 2010. Once again, the tape rules the roost. Broken resistance from the November high turned into first support and held like a champ. There is really nothing much to add on the daily chart because the ETF is in uncharted territory (new highs). Momentum is bullish with CCI firmly in positive territory. Key support on the daily chart is based on the November lows around 117.

Key Economic Reports:
Wed - Dec 22 - 07:00 - MBA Mortgage Applications
Wed - Dec 22 - 08:30 - GDP Estimate
Wed - Dec 22 - 10:00 - Existing Home Sales
Wed - Dec 22 - 10:30 - Crude Inventories
Thu - Dec 23 - 08:30 - Personal Income & Spending
Thu - Dec 23 - 08:30 - Durable Orders
Thu - Dec 23 - 08:30 - Initial Claims
Thu - Dec 23 - 09:55 - Michigan Sentiment
Thu - Dec 23 - 10:00 - New Home Sales
Charts of Interest: Tuesday and Thursday in separate post.
-----------------------------------------------------------------------------
This commentary and charts-of-interest are designed to stimulate thinking. This analysis is not a recommendation to buy, sell, hold or sell short any security (stock ETF or otherwise). We all need to think for ourselves when it comes to trading our own accounts. First, it is the only way to really learn. Second, we are the only ones responsible for our decisions. Think of these charts as food for further analysis. Before making a trade, it is important to have a plan. Plan the trade and trade the plan. Among other things, this includes setting a trigger level, a target area and a stop-loss level. It is also important to plan for three possible price movements: advance, decline or sideways. Have a plan for all three scenarios BEFORE making the trade. Consider possible holding times. And finally, look at overall market conditions and sector/industry performance.


