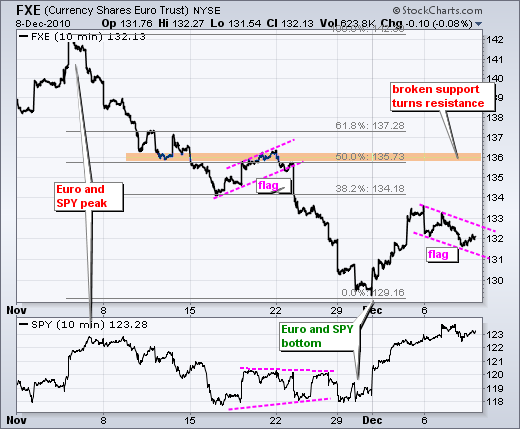
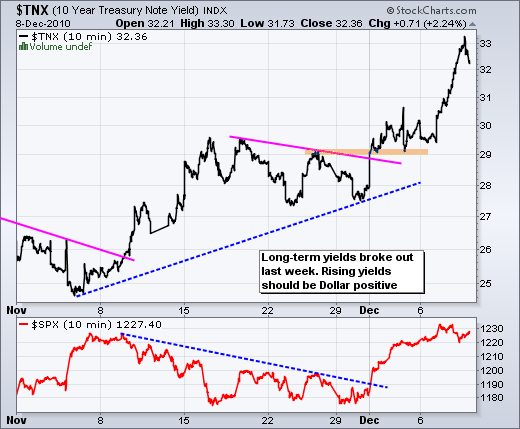
A surge in interest rates should be bullish for the Dollar, but the Dollar barely moved on Wednesday and Forex vigilantes could turn their sites on the Dollar. As noted in Wednesday's market message, bonds plunged because proposed legislation in DC would increase spending and decrease revenues. While this would indeed stimulate the economy, it would also weigh on the deficit and increase the national debt. This means more bond issuance, more bond supply and downward pressure on bond prices (upward pressure on rates). The Euro came under attack in November because of debt concerns. Well, debt concerns could also put downward pressure on the greenback. Both currencies have their problems. It is just a question of which one gets the most negative attention. The first chart shows the 10-year Treasury Yield ($TNX) holding its breakout and surging above 3.2% this week. The second chart shows the Euro Currency Trust (FXE) with a falling flag over the last four days. The short-term trend is down as long as the flag falls and I remain bearish on the Euro. However, I am watching flag resistance closely. A move above 133 would break the flag trendline and call for a continuation of last week's advance. This would target further strength towards the 136 area.

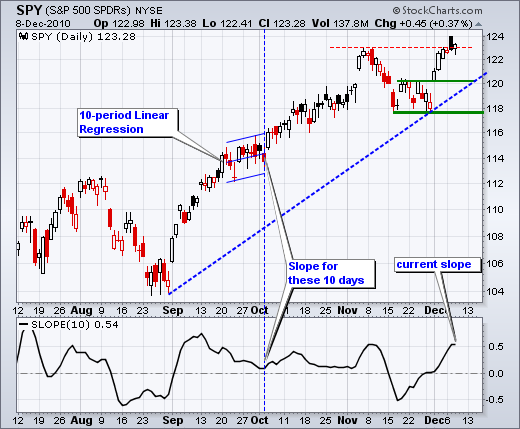
As far as stocks are concerned, a plan to increase spending and decrease revenues would stimulate the economy and this is bullish for stocks. Weakness in the Dollar would also be positive for stocks because it makes exports more competitive. Rising interest rates may choke off a recovery at some point, but I do not think we are near that point yet. Also keep in mind that yearend is approaching and underinvested portfolio managers will be under pressure to put some stocks on the books. On the daily chart, it looks like the bigger uptrend may just trump the short-term negatives. SPY was short-term overbought, near resistance from the November high, formed a narrow range days and failed to hold opening gains on Tuesday. Despite these negatives, the ETF managed to recover from early losses and end the day with a gain on Wednesday. The finance sector and banking group led the way and this is positive too.

The indicator window shows the 10-day Slope, which is the slope of a linear regression (rise over run). The three blue lines at the end of September show the Raff Regression Channel over a 10-day period. The middle line is a linear regression and the slope is slightly positive. Turning to current conditions, the 10-day slope turned positive at the end of November and a 10-day uptrend exists as long as this slope is positive.
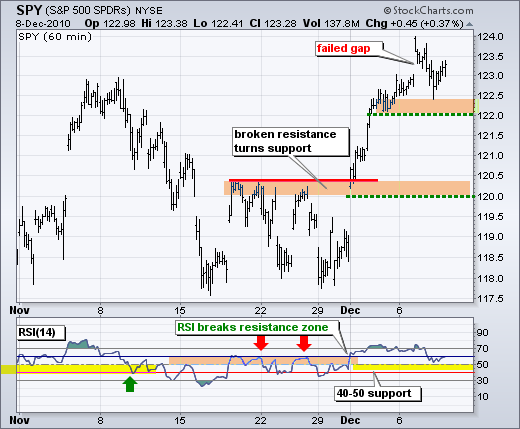
On the 60-minute chart, SPY filled the gap with a decline after Tuesday's strong open, but held support in the 122-122.5 zone. I will mark first support at 122. The bulls are in good shape as long as this level holds. Also watch RSI support in the 40-50 zone.

Key Economic Reports:
Thu - Dec 09 - 08:30 - Initial Claims
Thu - Dec 09 - 08:30 - Continuing Claims
Thu - Dec 10 - 08:30 - Trade Balance
Fri - Dec 10 - 09:55 - Michigan Sentiment
Charts of Interest: Tuesday and Thursday in separate post.
-----------------------------------------------------------------------------
This commentary and charts-of-interest are designed to stimulate thinking. This analysis is not a recommendation to buy, sell, hold or sell short any security (stock ETF or otherwise). We all need to think for ourselves when it comes to trading our own accounts. First, it is the only way to really learn. Second, we are the only ones responsible for our decisions. Think of these charts as food for further analysis. Before making a trade, it is important to have a plan. Plan the trade and trade the plan. Among other things, this includes setting a trigger level, a target area and a stop-loss level. It is also important to plan for three possible price movements: advance, decline or sideways. Have a plan for all three scenarios BEFORE making the trade. Consider possible holding times. And finally, look at overall market conditions and sector/industry performance.


