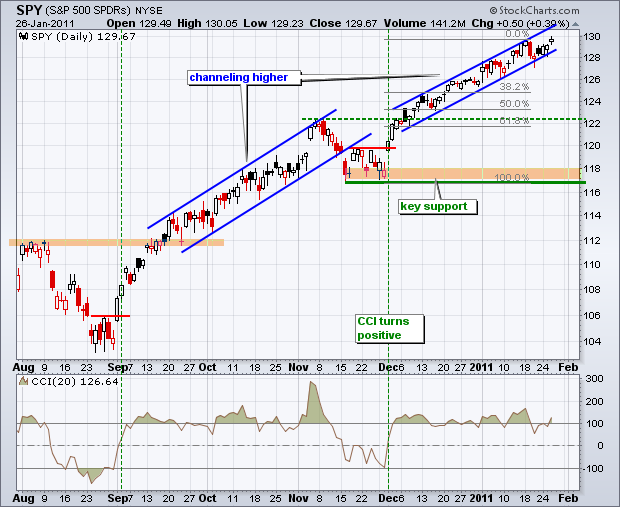
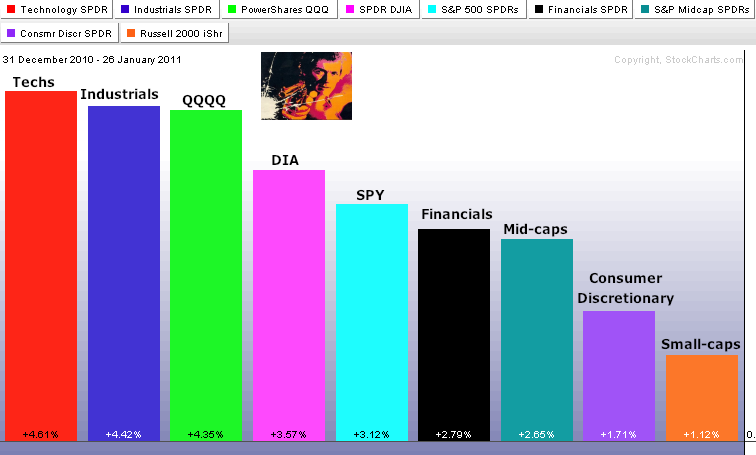
It is certainly tempting to pick a top and turn bearish now, but such thoughts bring me back to a quote from Dirty Harry. You've got to ask yourself one question: "Do I feel lucky?" Well, do ya punk bear? As noted before, sentiment is excessively bullish enough to warrant a downturn. Stocks are overbought enough to warrant a pullback. Small-caps and the consumer discretionary are flashing warning signs with relative weakness over the last few weeks. I think a pullback is not so much a question of if, but rather when. However, as Jason Goepfert of SentimenTrader.com notes the following: "the increasing chorus calling for a pullback has caused individual investors to take a step back. The AAII Bull Ratio has dropped into neutral". Is there anyone NOT looking for a pullback? The market rarely obliges the crowd.


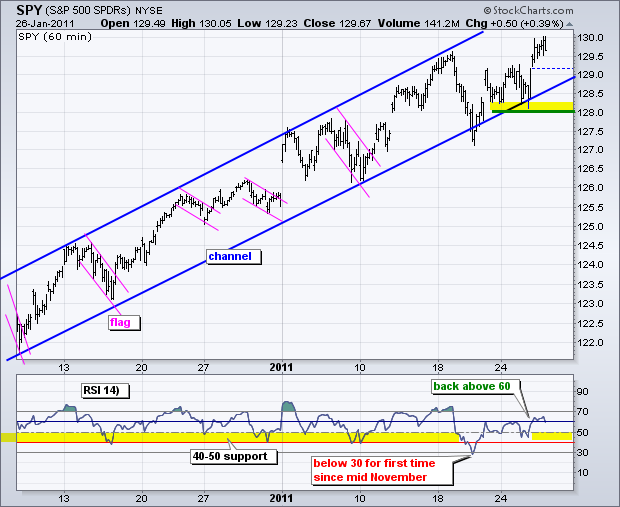
At this point, I am still watching three things for short-term clues on the "when": basic price analysis, momentum and breadth. Price-wise, the SPY trend is up as the ETF holds its rising price channel. Key support on the 60-minute chart remains at 128. A move below this level would reverse the current uptrend and call for a retracement of the prior advance, perhaps back to the 122 area. RSI dipped below 30 last week to move momentum into bear mode, but surged above 60 yesterday to put RSI back in the bullish camp. Three of the four breadth indicators remain in bull mode. However, it would not take much weakness to push the majority (3 of 4) into bear mode.
Key Economic Reports:
Thu - Jan 27 - 08:30 - Job Claims
Thu - Jan 27 - 08:30 - Durable Orders
Thu - Jan 27 - 10:00 - Pending Home Sales
Fri - Jan 28 - 08:30 - GDP Estimate
Fri - Jan 28 - 09:55 - Michigan Sentiment
Charts of Interest: Tuesday and Thursday in separate post.
-----------------------------------------------------------------------------
This commentary and charts-of-interest are designed to stimulate thinking. This analysis is not a recommendation to buy, sell, hold or sell short any security (stock ETF or otherwise). We all need to think for ourselves when it comes to trading our own accounts. First, it is the only way to really learn. Second, we are the only ones responsible for our decisions. Think of these charts as food for further analysis. Before making a trade, it is important to have a plan. Plan the trade and trade the plan. Among other things, this includes setting a trigger level, a target area and a stop-loss level. It is also important to plan for three possible price movements: advance, decline or sideways. Have a plan for all three scenarios BEFORE making the trade. Consider possible holding times. And finally, look at overall market conditions and sector/industry performance.

