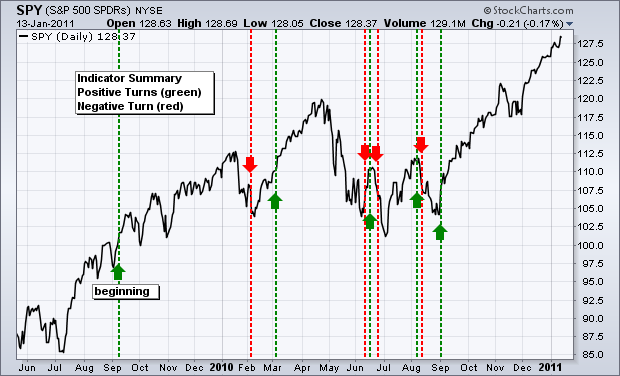
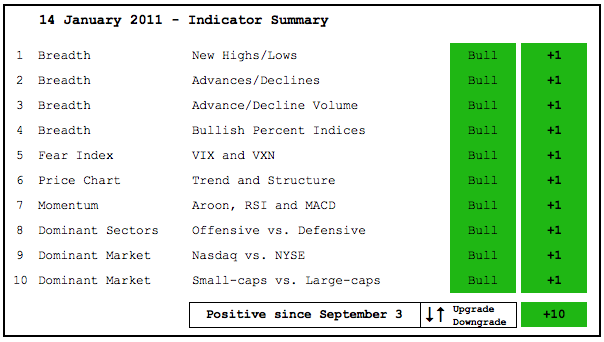
The stock market appears to be on bullish auto-pilot. In fact, it seems that a bit of complacency may be setting in. While I remain concerned with excessively bullish sentiment, a bearish signal in the put-call ratio and overbought conditions, there is simply no evidence of selling pressure on the price chart or in key breadth indicators. The AD Lines hit new reaction highs again this week. Net New Highs remain firmly positive. Finance and technology are leading. With the indicator summary at +10, it would take a few weeks of selling pressure to turn it negative. I have added an SPY chart with the signal summary at the end of this commentary.
This table is designed to offer an objective look at current market conditions. It does not aim to pick tops or bottoms. Instead, it seeks to identify noticeable shifts in balance of power (bull/bear) within the stock market. With 10 indicator groups, the medium-term evidence is unlikely to change drastically overnight. Previous turns include: Started on 11-Sept-09 as positive. Negative on 5-February-10. Positive on 5-March-10. Negative on 11-June-10. Positive on 18-June-10. Negative on 24-June-10. Positive on 6-August-10. Negative on 13-August-10. Positive on 3-September-10.


