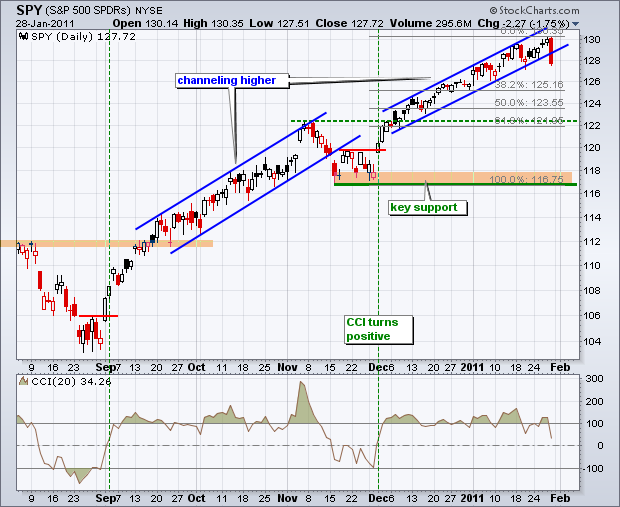
After grinding higher for several weeks to keep the uptrend in place, stocks turned sharply lower on Friday and the bulk of the short-term evidence is now bearish. Media suggests that the turmoil in Egypt is the culprit for the sharp decline in stocks and the bounce in the Dollar, Bonds and Oil. Egypt is no doubt an important player in the Middle East, but I would not give these events full credit for toppling an overbought stock market that was due for a correction. Coincidence is not the same as causation.
On the daily chart, SPY broke channel support with the sharpest decline since August. This argues for a correction within the bigger uptrend. 122 marks the first support zone on the daily chart. Broken resistance and the 62% retracement combine to mark this zone. CCI turned lower, but has yet to break below zero. This is the next level to watch for momentum.
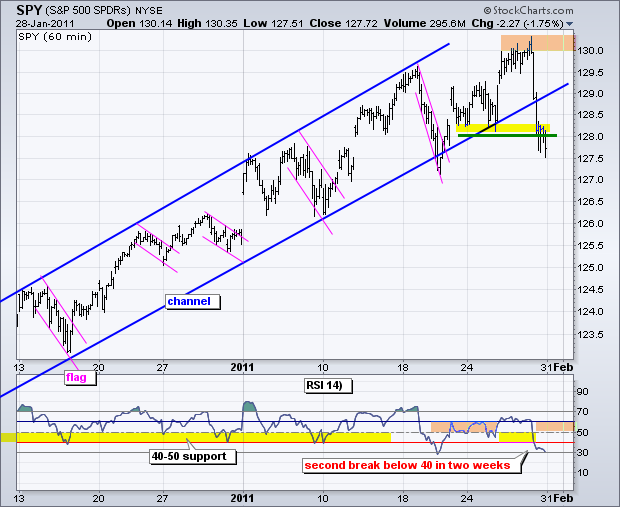
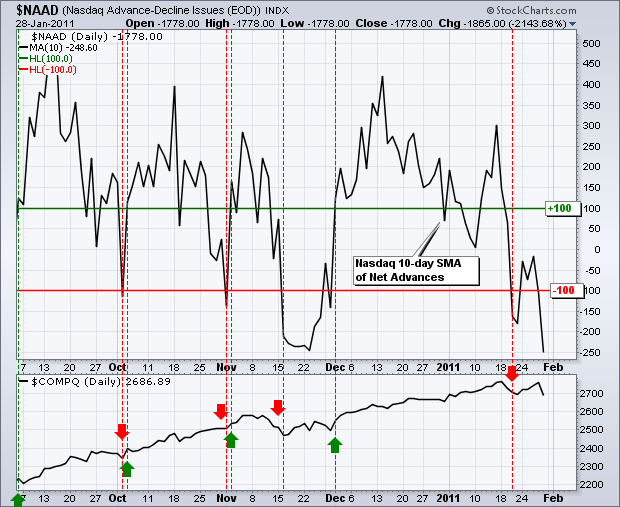
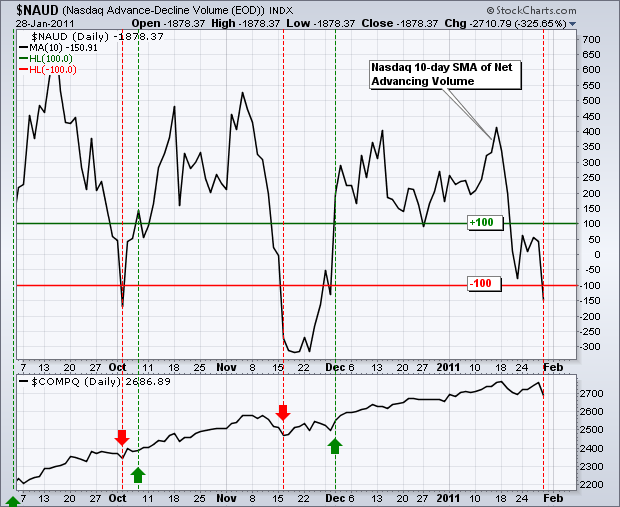
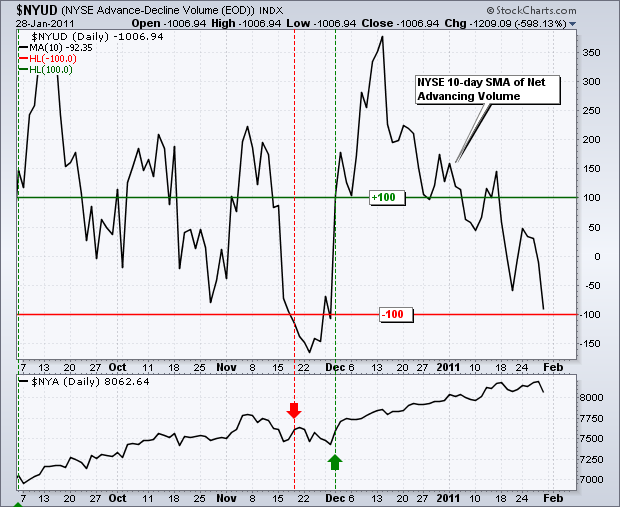
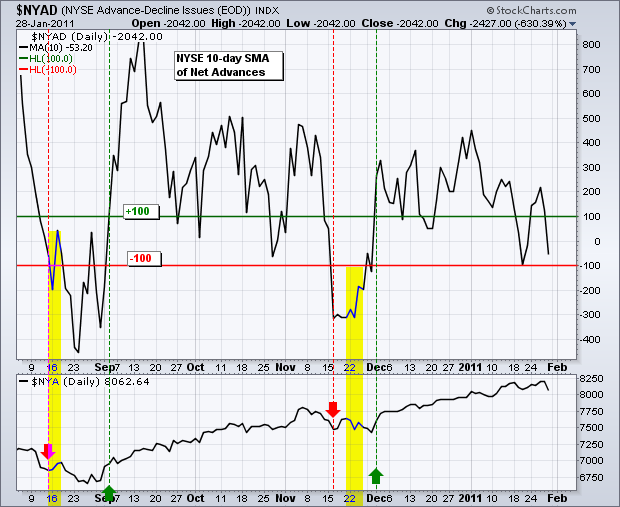
The short-term evidence is bearish as SPY broke support at 128, RSI move below 40 for the second time in as many weeks and two of the four breadth indicators turned bearish. At this point, I will simply mark resistance in the 130 area. Most European and Asian markets are down today and we could see some follow through on Monday morning. Note, however, that SPY and the other major index ETFs will be short-term oversold with further weakness and some sort of bounce is likely. This bounce could retraced 50% of whatever decline took place over the last few days. The breadth charts are shown below.
Key Economic Reports:
Mon - Jan 31 - 08:30 - Personal Income & Spending
Mon - Jan 31 - 09:45 - Chicago PMI
Tue - Feb 01 - 10:00 - Construction Spending
Tue - Feb 01 - 10:00 - ISM Index
Tue - Feb 01 - 15:00 - Auto/Truck Sales
Wed - Feb 02 - 07:00 - MBA Mortgage Purchase Index
Wed - Feb 02 - 07:30 - Challenger Job Cuts
Wed - Feb 02 - 08:15 - ADP Employment Change
Wed - Feb 02 - 10:30 - Oil Inventories
Thu - Feb 03 - 08:30 - Jobless Claims
Thu - Feb 03 - 10:00 - Factory Orders
Thu - Feb 03 - 10:00 - ISM Services
Thu - Feb 03 - 12:30 – Bernanke Speaks
Fri - Feb 04 - 08:30 - Employment Report
Charts of Interest: Tuesday and Thursday in separate post.
-----------------------------------------------------------------------------
This commentary and charts-of-interest are designed to stimulate thinking. This analysis is not a recommendation to buy, sell, hold or sell short any security (stock ETF or otherwise). We all need to think for ourselves when it comes to trading our own accounts. First, it is the only way to really learn. Second, we are the only ones responsible for our decisions. Think of these charts as food for further analysis. Before making a trade, it is important to have a plan. Plan the trade and trade the plan. Among other things, this includes setting a trigger level, a target area and a stop-loss level. It is also important to plan for three possible price movements: advance, decline or sideways. Have a plan for all three scenarios BEFORE making the trade. Consider possible holding times. And finally, look at overall market conditions and sector/industry performance.

