It is a pretty big week news-wise. First, earnings season is in full swing with over 350 reports slated for this week (and next). Second, the Fed starts its two day meeting on Tuesday with its policy statement expected at 2:15PM on Wednesday. Third, there will be a smattering of economic reports, including New Home Sales on Wednesday and Durable Goods on Thursday.
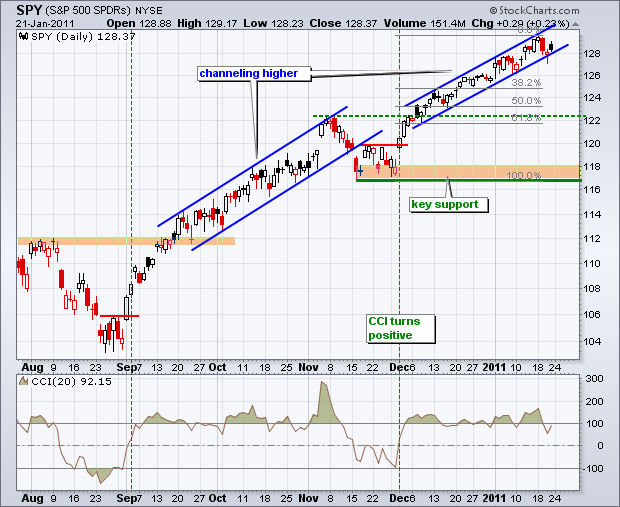
The daily chart analysis for SPY remains unchanged. The medium-term trend is up as SPY holds within a tight rising channel. A channel break would argue for a correction with first support marked by broken resistance around 122. This area also marks a 50-62% retracement of the December-January advance. CCI remains in positive territory to keep momentum bullish. A move into negative territory would signal that a correction is underway.
The 60-minute chart provided the first signs of weakness since mid November as RSI broke below 30 and SPY pierced its channel trendline. This momentum indicator bounced back, but dips below 30 are more common in downtrends than uptrends. The problem, of course, is that the medium-term trend (daily chart) is clearly up. This makes a short-term downtrend a correction or counter-trend move. A short-term downtrend combined with a medium-term uptrend could result in a sideways movement or trading range. A big news week and conflicting trends could make this a good week to clean the garage.

Breadth weakened further, but only one of the four breadth indicators is in bear mode. As a bottom line, I will turn short-term bearish when three of the four breadth indicators move below -100. These four indicators are the 10-day SMAs for Nasdaq Net Advances ($NAAD), Nasdaq Net Advancing Volume ($NAUD), NYSE Net Advances ($NYAD) and NYSE Net Advancing Volume ($NYUD). The 10-day SMA for Nasdaq Net Advances ($NAAD) is the only one to dip below -100 so far.


Key Economic Reports:
Tue - Jan 25 - 09:00 – FOMC Meeting Starts
Tue - Jan 25 - 09:00 - Case-Shiller Index
Tue - Jan 25 - 10:00 - Consumer Confidence
Wed - Jan 26 - 07:00 - MBA Mortgage Purchase Index
Wed - Jan 26 - 10:00 - New Home Sales
Wed - Jan 26 - 10:30 - Oil Inventories
Wed - Jan 26 - 14:15 - FOMC Rate Decision/Policy Statement
Thu - Jan 27 - 08:30 - Job Claims
Thu - Jan 27 - 08:30 - Durable Orders
Thu - Jan 27 - 10:00 - Pending Home Sales
Fri - Jan 28 - 08:30 - GDP Estimate
Fri - Jan 28 - 09:55 - Michigan Sentiment
Charts of Interest: Tuesday and Thursday in separate post.
-----------------------------------------------------------------------------
This commentary and charts-of-interest are designed to stimulate thinking. This analysis is not a recommendation to buy, sell, hold or sell short any security (stock ETF or otherwise). We all need to think for ourselves when it comes to trading our own accounts. First, it is the only way to really learn. Second, we are the only ones responsible for our decisions. Think of these charts as food for further analysis. Before making a trade, it is important to have a plan. Plan the trade and trade the plan. Among other things, this includes setting a trigger level, a target area and a stop-loss level. It is also important to plan for three possible price movements: advance, decline or sideways. Have a plan for all three scenarios BEFORE making the trade. Consider possible holding times. And finally, look at overall market conditions and sector/industry performance.


