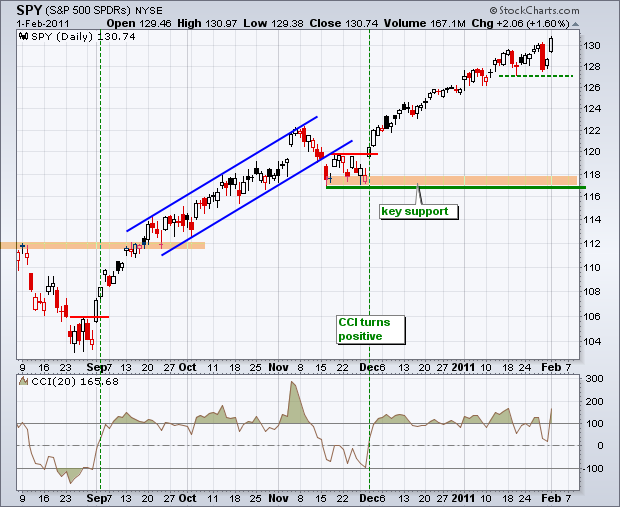
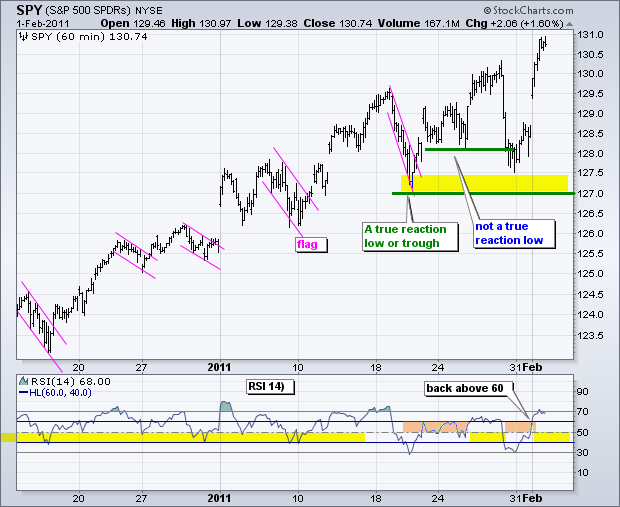
A downtrend is impossible when an index hits a new high. Monday's short-term trend reversal has become a whipsaw or simply a bad call. With a gap up and break above 130, SPY re-established its short-term uptrend. A postmortem reveals four reasons for the errant trend reversal. First, the medium-term uptrend was never in jeopardy. The bigger force at work was still bullish. Even though SPY was ripe for a short-term correction or pullback, the bigger uptrend still holds the bullish trump cards and can play them at any time. Second, there has been a strong tendency for stocks to move higher on the first day of the month. SPY has advanced 12 of the last 14 times on the first day of the month. The exceptions were June and July. Third, I key short-term support for SPY too close. Yes, hindsight is 20-20, but we can learn from it. The last true reaction low was around 127 from the falling flag the third week of January. Support at 128 was not a true reaction low. With RSI moving back above 60 and SPY moving above 130.5, the short-term uptrend is back in force with key support in the 127-127.5 area. The last reason and charts can be found after the jump.

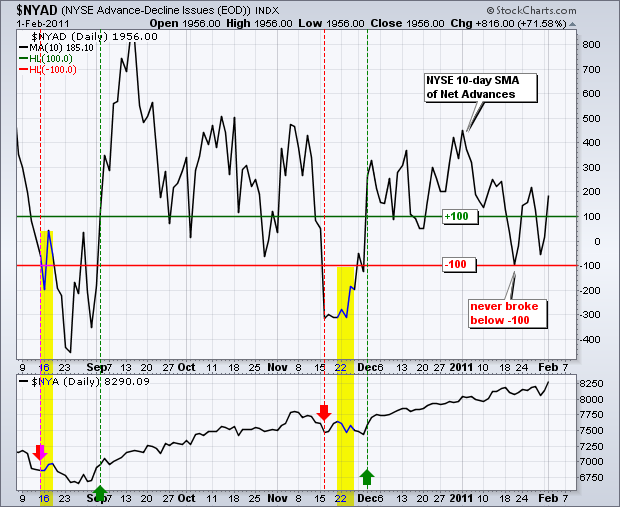
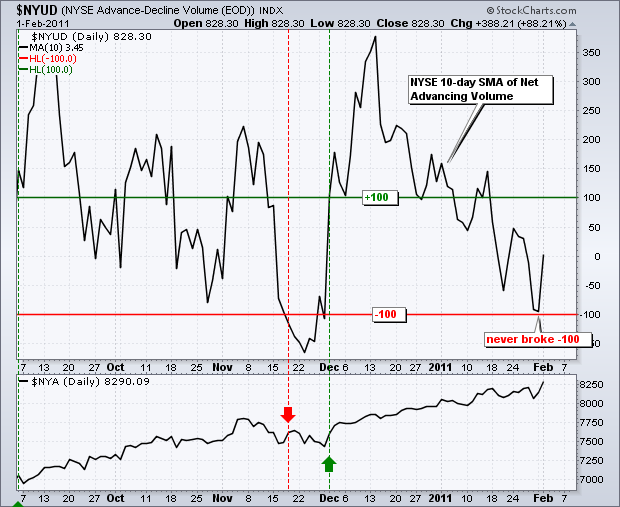
The fourth and final reason comes from the assessment of the key breadth indicators. The 10-day SMAs for the NYSE Net Advances ($NYAD) and NYSE Net Advancing Volume ($NYUD) did not move below -100 to trigger a bearish signal. Even though the corresponding Nasdaq indicators turned bearish, the other half of the market did not confirm. More importantly, SPY consists of nine sectors and the Nasdaq is dominated by tech. Technology is just one of nine for SPY. NYSE breadth indicators better represent the other eight sectors.


Key Economic Reports:
Wed - Feb 02 - 07:00 - MBA Mortgage Purchase Index
Wed - Feb 02 - 07:30 - Challenger Job Cuts
Wed - Feb 02 - 08:15 - ADP Employment Change
Wed - Feb 02 - 10:30 - Oil Inventories
Thu - Feb 03 - 08:30 - Jobless Claims
Thu - Feb 03 - 10:00 - Factory Orders
Thu - Feb 03 - 10:00 - ISM Services
Thu - Feb 03 - 12:30 – Bernanke Speaks
Fri - Feb 04 - 08:30 - Employment Report
Charts of Interest: Tuesday and Thursday in separate post.
-----------------------------------------------------------------------------
This commentary and charts-of-interest are designed to stimulate thinking. This analysis is not a recommendation to buy, sell, hold or sell short any security (stock ETF or otherwise). We all need to think for ourselves when it comes to trading our own accounts. First, it is the only way to really learn. Second, we are the only ones responsible for our decisions. Think of these charts as food for further analysis. Before making a trade, it is important to have a plan. Plan the trade and trade the plan. Among other things, this includes setting a trigger level, a target area and a stop-loss level. It is also important to plan for three possible price movements: advance, decline or sideways. Have a plan for all three scenarios BEFORE making the trade. Consider possible holding times. And finally, look at overall market conditions and sector/industry performance.


