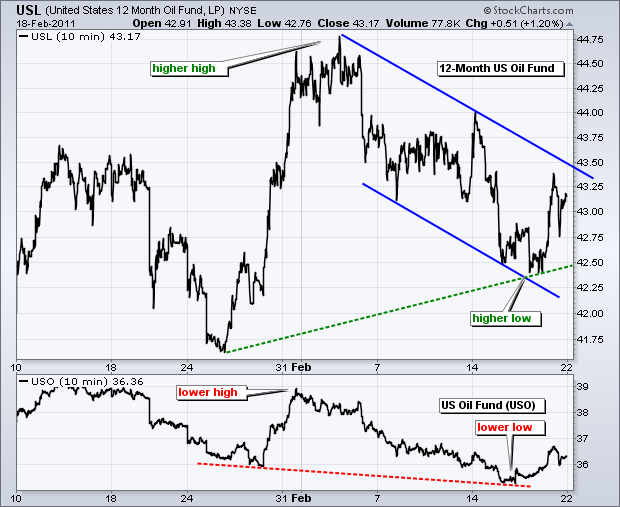
Unrest in Libya is sparking the flight to safety trade in a big way. Libya produces around 1.8 million barrels of oil per day and accounts for a 2% of global output. Even though Saudia Arabia has around 3 million barrels of spare capacity, the market is concerned that this unrest will spread to other major oil producers in the region. Brent Crude (North Sea oil) is trading near $108 and West Texas Intermediate ($WTIC) is trading around $94, which is up over 10% since Thursday. Sudden and sharp spikes in oil prices are clearly weighing on an overbought stock market.
The chart above shows the US 12-Month Oil Fund (USL) with a bullish flag/channel. Obviously, we are going to see a big gap and breakout today. USL is expected to open above the February high. As the name implies, USL spreads its West Texas Intermediate futures contracts over a 12-month period to reduce value-loss from the contango. Futures contracts for the USO Oil Fund (USO) are spread over a shorter timeframe and this makes then more prone to contango losses. USL also seems to track West Texas Intermediate a little better. Notice the higher high in in early February and the higher low last week. USL is, however, less sensitive than USO because the futures contracts are spread a 12-month period. Check out www.unitedstates12monthoilfund.com for more details.
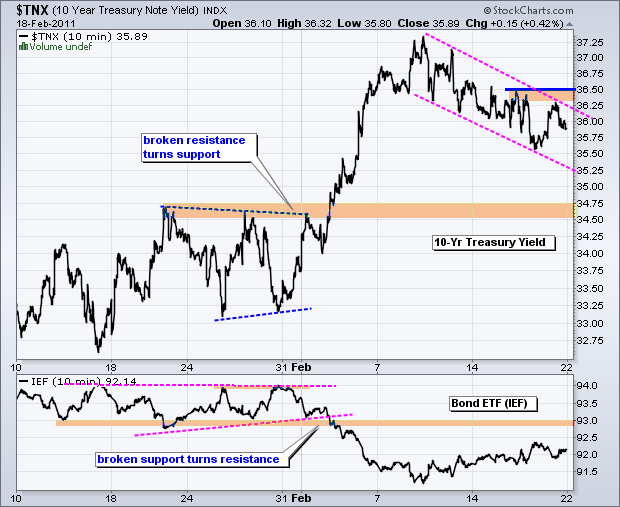
In addition to oil, money is moving into bonds and gold. The 10-year Treasury Yield ($TNX), which moves opposite of bonds, peaked on 9-Feb and worked its way lower the last 10 days. The next support zone is around 34.5-34.75 (3.45% to 3.475%). The 7-10 year Bond ETF (IEF) continues to work its way higher with the next resistance zone around 93.
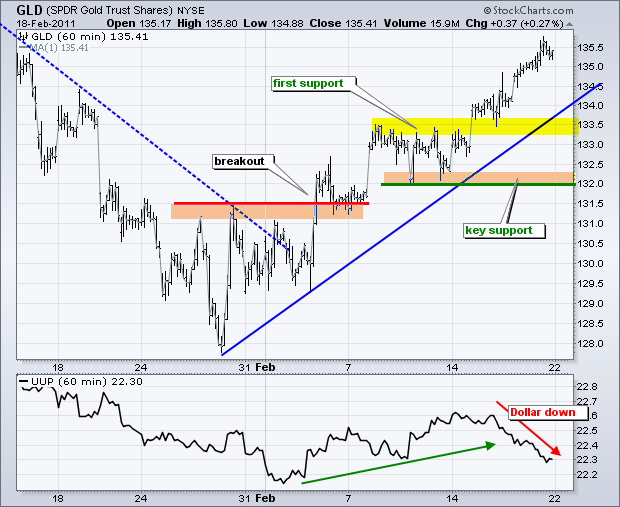
The Gold SPDR (GLD) reversed its January downtrend with a breakout in early February. It has been nothing but up this month. GLD advanced as the Dollar advanced the first two weeks of February and continued higher even as the Dollar declined last week. Broken resistance around 133.5 marks the first support zone. The November-December highs (daily chart) mark the upside target in the 139.5 area. This level will most likely be hit today.
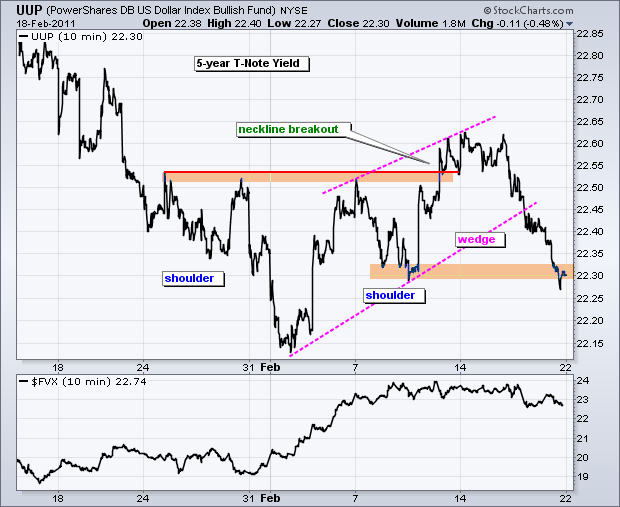
The US Dollar Fund (UUP) got slammed last week with a 1.3% decline. The inverse head-and-shoulders breakout evolved into a rising wedge and UUP broke the wedge trendline last week. However, UUP hit support around 22.30 last Friday and the futures market is pointing to a strong open today. This will reinforce support and possibly revive the mid February breakout. Keep in mind that the Euro accounts for some 57% of the US Dollar Fund and the US Dollar Index. The surge in Brent Crude is going to affect Europe more than the surge in West Texas Intermediate is going to affect the US. Moreover, Europe is much closer to the North African unrest than the US.
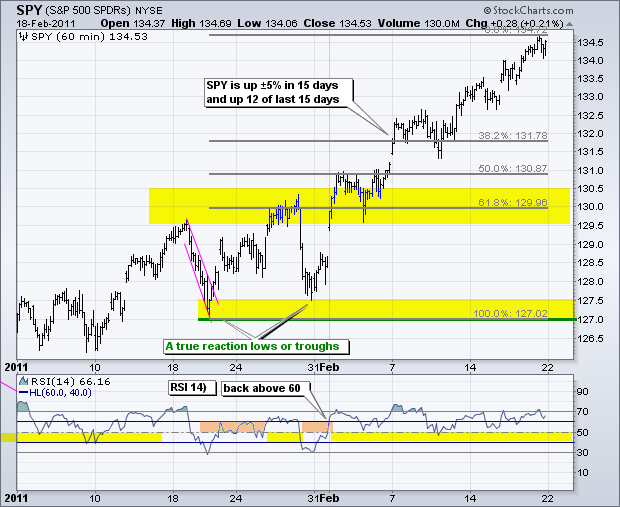
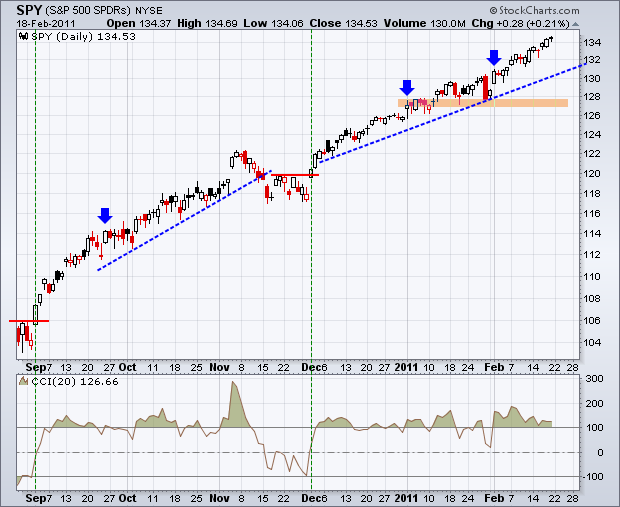
The surge in oil prices and spreading unrest in the Middle East and North Africa will hit stocks hard on the open today. At this point, I will endeavor to establish the next short-term support level from which we might expect a bounce or consolidation. There is a broken resistance zone around 130 and this level also marks a 62% retracement of the latest advance. A move to 130 (-4.5 points) would mark a 3.3% decline from current levels (134.5). While definitely a sharp decline, it would not break key short-term support or endanger the medium-term uptrend. The two reaction lows around 127 mark key short-term support. Today's inter-market coverage accounts for Tuesday's Charts of Interest.
Key Economic Reports/Events:
Feb 22 - 09:00 - Case-Shiller Housing Index
Feb 22 - 10:00 - Consumer Confidence
Feb 23 - 07:00 - MBA Mortgage Index
Feb 23 - 10:00 - Existing Home Sales
Feb 24 - 08:30 - Jobless Claims
Feb 24 - 08:30 - Durable Orders
Feb 24 - 10:00 - New Home Sales
Feb 24 - 11:00 - Oil Inventories
Feb 25 - 08:30 - GDP
Feb 25 - 09:55 - Michigan Sentiment
Charts of Interest: Thursday in separate post.
-----------------------------------------------------------------------------
This commentary and charts-of-interest are designed to stimulate thinking. This analysis is not a recommendation to buy, sell, hold or sell short any security (stock ETF or otherwise). We all need to think for ourselves when it comes to trading our own accounts. First, it is the only way to really learn. Second, we are the only ones responsible for our decisions. Think of these charts as food for further analysis. Before making a trade, it is important to have a plan. Plan the trade and trade the plan. Among other things, this includes setting a trigger level, a target area and a stop-loss level. It is also important to plan for three possible price movements: advance, decline or sideways. Have a plan for all three scenarios BEFORE making the trade. Consider possible holding times. And finally, look at overall market conditions and sector/industry performance.
In addition to oil, money is moving into bonds and gold. The 10-year Treasury Yield ($TNX), which moves opposite of bonds, peaked on 9-Feb and worked its way lower the last 10 days. The next support zone is around 34.5-34.75 (3.45% to 3.475%). The 7-10 year Bond ETF (IEF) continues to work its way higher with the next resistance zone around 93.

The Gold SPDR (GLD) reversed its January downtrend with a breakout in early February. It has been nothing but up this month. GLD advanced as the Dollar advanced the first two weeks of February and continued higher even as the Dollar declined last week. Broken resistance around 133.5 marks the first support zone. The November-December highs (daily chart) mark the upside target in the 139.5 area. This level will most likely be hit today.

The US Dollar Fund (UUP) got slammed last week with a 1.3% decline. The inverse head-and-shoulders breakout evolved into a rising wedge and UUP broke the wedge trendline last week. However, UUP hit support around 22.30 last Friday and the futures market is pointing to a strong open today. This will reinforce support and possibly revive the mid February breakout. Keep in mind that the Euro accounts for some 57% of the US Dollar Fund and the US Dollar Index. The surge in Brent Crude is going to affect Europe more than the surge in West Texas Intermediate is going to affect the US. Moreover, Europe is much closer to the North African unrest than the US.

The surge in oil prices and spreading unrest in the Middle East and North Africa will hit stocks hard on the open today. At this point, I will endeavor to establish the next short-term support level from which we might expect a bounce or consolidation. There is a broken resistance zone around 130 and this level also marks a 62% retracement of the latest advance. A move to 130 (-4.5 points) would mark a 3.3% decline from current levels (134.5). While definitely a sharp decline, it would not break key short-term support or endanger the medium-term uptrend. The two reaction lows around 127 mark key short-term support. Today's inter-market coverage accounts for Tuesday's Charts of Interest.


Key Economic Reports/Events:
Feb 22 - 09:00 - Case-Shiller Housing Index
Feb 22 - 10:00 - Consumer Confidence
Feb 23 - 07:00 - MBA Mortgage Index
Feb 23 - 10:00 - Existing Home Sales
Feb 24 - 08:30 - Jobless Claims
Feb 24 - 08:30 - Durable Orders
Feb 24 - 10:00 - New Home Sales
Feb 24 - 11:00 - Oil Inventories
Feb 25 - 08:30 - GDP
Feb 25 - 09:55 - Michigan Sentiment
Charts of Interest: Thursday in separate post.
-----------------------------------------------------------------------------
This commentary and charts-of-interest are designed to stimulate thinking. This analysis is not a recommendation to buy, sell, hold or sell short any security (stock ETF or otherwise). We all need to think for ourselves when it comes to trading our own accounts. First, it is the only way to really learn. Second, we are the only ones responsible for our decisions. Think of these charts as food for further analysis. Before making a trade, it is important to have a plan. Plan the trade and trade the plan. Among other things, this includes setting a trigger level, a target area and a stop-loss level. It is also important to plan for three possible price movements: advance, decline or sideways. Have a plan for all three scenarios BEFORE making the trade. Consider possible holding times. And finally, look at overall market conditions and sector/industry performance.

About the author:
Arthur Hill, CMT, is the Chief Technical Strategist at TrendInvestorPro.com. Focusing predominantly on US equities and ETFs, his systematic approach of identifying trend, finding signals within the trend, and setting key price levels has made him an esteemed market technician. Arthur has written articles for numerous financial publications including Barrons and Stocks & Commodities Magazine. In addition to his Chartered Market Technician (CMT) designation, he holds an MBA from the Cass Business School at City University in London.
Learn More
