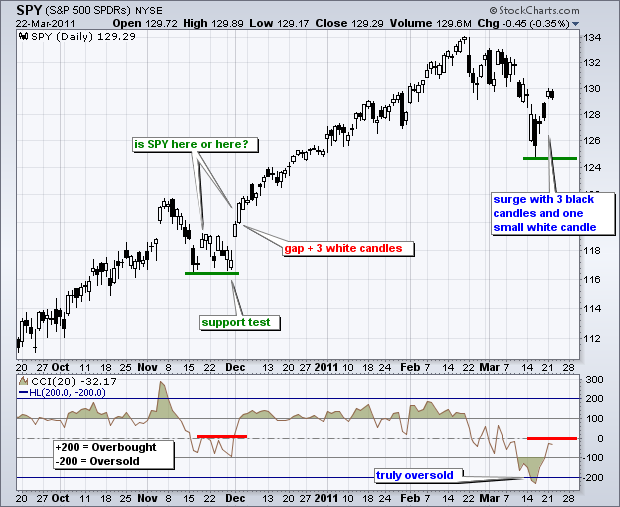
On the daily chart, SPY surged from ±125 to ±130 with two black candlesticks and a small white candlestick. There were three strong opens, but the ETF moved lower after the first two gaps (Thursday-Friday) and barely advanced after Monday's gap. As noted yesterday, this is uninspiring candlestick action. I will cover the differences between $SPX and SPY candlesticks in the Market Message later this afternoon. Also notice that CCI is near the zero line, which can act as a resistance area during a decline.

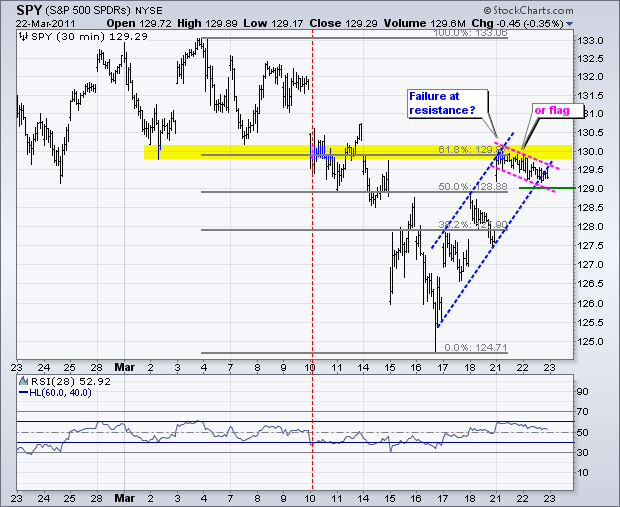
On the 30-minute chart, we can see the three gaps and three consolidations. The last gap pushed SPY to the 62% retracement mark and broken support. These combine to mark resistance in the 130 area. The blue dotted lines show a rising channel and a move below 129 would break channel support. This would be the first negative since the 17-March gap and argue for a pullback or even a test of last week's lows. The bullish alternative is a falling flag over the last two days (pink lines). A move above 130 would signal a continuation higher.

Key Economic Reports/Events:
Wed - Mar 23 - 07:00 - MBA Mortgage Index
Wed - Mar 23 - 10:00 - New Home Sales
Wed - Mar 23 - 10:30 - Crude Inventories
Thu - Mar 24 - 08:30 - Initial Claims
Thu - Mar 24 - 08:30 - Durable Orders
Fri - Mar 25 - 08:30 - GDP Estimate
Fri - Mar 25 - 09:55 - Michigan Sentiment
Charts of Interest: Tuesday and Thursday in separate post.
-----------------------------------------------------------------------------
This commentary and charts-of-interest are designed to stimulate thinking. This analysis is not a recommendation to buy, sell, hold or sell short any security (stock ETF or otherwise). We all need to think for ourselves when it comes to trading our own accounts. First, it is the only way to really learn. Second, we are the only ones responsible for our decisions. Think of these charts as food for further analysis. Before making a trade, it is important to have a plan. Plan the trade and trade the plan. Among other things, this includes setting a trigger level, a target area and a stop-loss level. It is also important to plan for three possible price movements: advance, decline or sideways. Have a plan for all three scenarios BEFORE making the trade. Consider possible holding times. And finally, look at overall market conditions and sector/industry performance.


