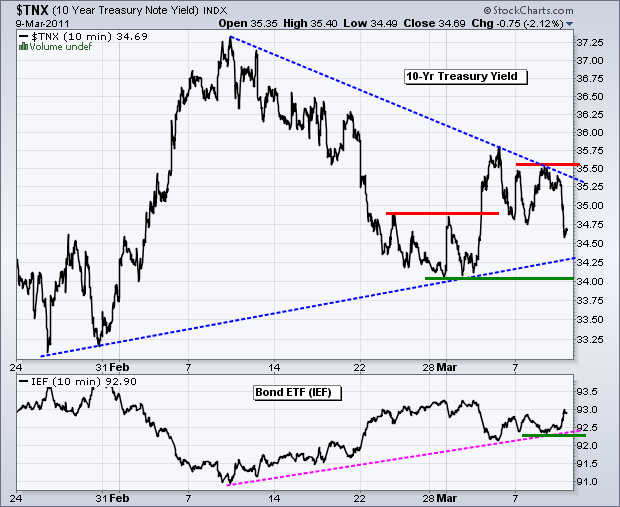
There appear to be some changes afoot in the intermarket arena that could have a negative effect on stocks. We already know about the surge in oil and commodity prices. With a sharp decline on Wednesday, the 10-year Treasury Yield ($TNX) failed to hold last week's surge and moved back below 34.75 (3.475%). This decline in yields reflects a rise in bond prices. The indicator window shows the 7-10 year Bond ETF (IEF) within an uptrend since mid February. This week's lows mark support. With stocks and bonds negatively correlated the last 15 months, a rise in bonds would be negative for stocks.
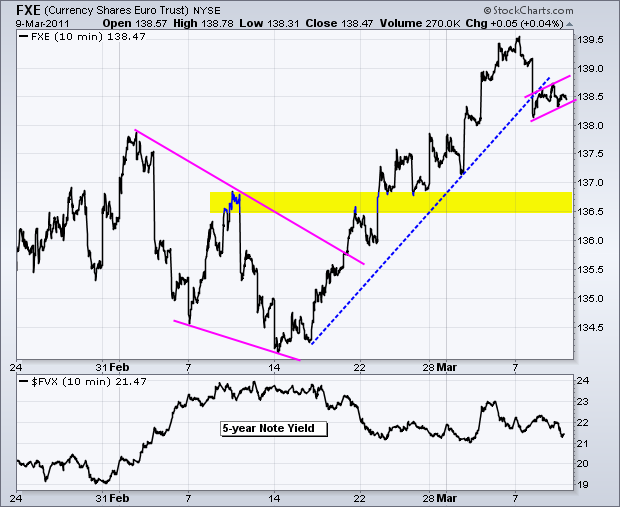
European debt issues may return to the forefront. Greece, Ireland and Portugal are back in the news. The yield on Portuguese, Irish and Greek bonds reached their highest levels since 1999, which is when the Euro began. FT.com reports that borrowing costs for the 10-year bond reached 5.51% for Spain, 7.63% for Portugal, 9.58% for Ireland and 12.90% for Greece. The bond vigilantes are making its harder for these countries to finance their debt burdens. The Euro Currency Trust (FXE) went on a three-week tear with a move from 134.3 to 139.5 (+1%). While not a big move for stocks, it is a big move for a currency. The ETF declined sharply to break the mid February trendline. A rising flag formed the last two days and a flag break would open the door to broken resistance in the 136.5 area. Such a move could spur the flight-to-safety trade, which would benefit bonds and weigh on stocks.
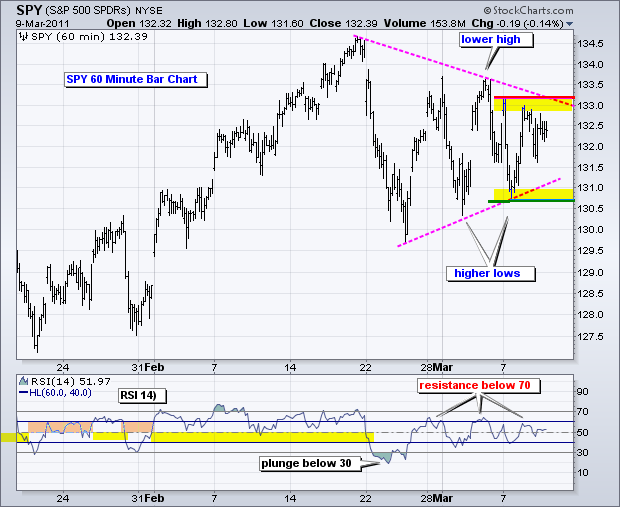
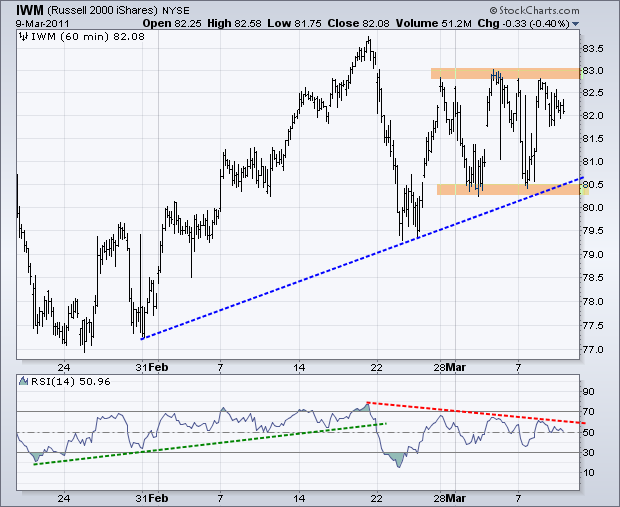
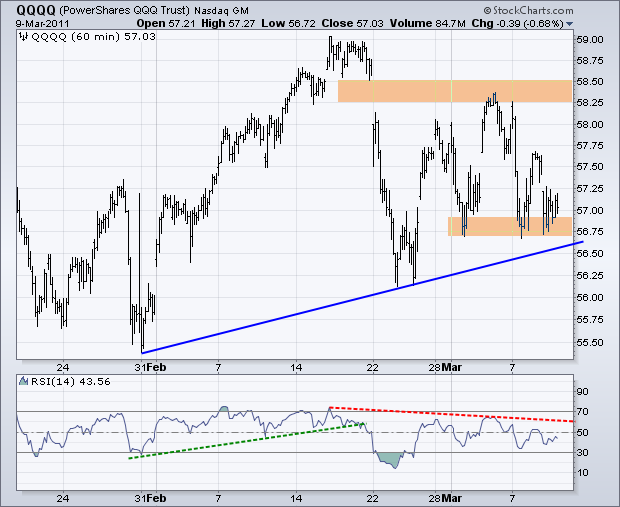
The evidence appears to be moving further in favor of the bears, but there are some clear splits within the stock market. The Nasdaq 100 ETF (QQQQ) is relatively weak as it trades near its March lows, but the Russell 2000 ETF (IWM) is relatively strong as it challenges its March highs. Big techs show relative weakness as small-caps show relative strength. SPY is caught somewhere in the middle with a triangle consolidation. Four out of four breadth indicators moved below their bearish thresholds. RSI on the 60-minute chart plunged below 30 in late February and failed to reach 70 on the last three bounces. These indicators favor the bears, but we have yet to see a clear breakdown on the price chart. Now we have the intermarket forces starting to align with the bears. I am now thinking that the onus is on the bulls to prove the bears wrong. This means IWM needs to break above its March highs. The 10-year Treasury Yield ($TNX) needs to surge above 35.6 (3.56%) and bonds need to break support. And oil needs to fall. Such a sequence would be short-term bullish for stocks. Barring such moves, the odds are starting to favor a continuation of the late February decline in SPY and the other major index ETFs.
Key Economic Reports/Events:
Thu - Mar 10 - 08:30 - Jobless Claims
Fri - Mar 11 - 08:30 - Retail Sales
Fri - Mar 11 - 09:55 - Michigan Sentiment
Fri - Mar 11 - 10:00 - Business Inventories
Charts of Interest: Tuesday and Thursday in separte post.
-----------------------------------------------------------------------------
This commentary and charts-of-interest are designed to stimulate thinking. This analysis is not a recommendation to buy, sell, hold or sell short any security (stock ETF or otherwise). We all need to think for ourselves when it comes to trading our own accounts. First, it is the only way to really learn. Second, we are the only ones responsible for our decisions. Think of these charts as food for further analysis. Before making a trade, it is important to have a plan. Plan the trade and trade the plan. Among other things, this includes setting a trigger level, a target area and a stop-loss level. It is also important to plan for three possible price movements: advance, decline or sideways. Have a plan for all three scenarios BEFORE making the trade. Consider possible holding times. And finally, look at overall market conditions and sector/industry performance.

The evidence appears to be moving further in favor of the bears, but there are some clear splits within the stock market. The Nasdaq 100 ETF (QQQQ) is relatively weak as it trades near its March lows, but the Russell 2000 ETF (IWM) is relatively strong as it challenges its March highs. Big techs show relative weakness as small-caps show relative strength. SPY is caught somewhere in the middle with a triangle consolidation. Four out of four breadth indicators moved below their bearish thresholds. RSI on the 60-minute chart plunged below 30 in late February and failed to reach 70 on the last three bounces. These indicators favor the bears, but we have yet to see a clear breakdown on the price chart. Now we have the intermarket forces starting to align with the bears. I am now thinking that the onus is on the bulls to prove the bears wrong. This means IWM needs to break above its March highs. The 10-year Treasury Yield ($TNX) needs to surge above 35.6 (3.56%) and bonds need to break support. And oil needs to fall. Such a sequence would be short-term bullish for stocks. Barring such moves, the odds are starting to favor a continuation of the late February decline in SPY and the other major index ETFs.


Key Economic Reports/Events:
Thu - Mar 10 - 08:30 - Jobless Claims
Fri - Mar 11 - 08:30 - Retail Sales
Fri - Mar 11 - 09:55 - Michigan Sentiment
Fri - Mar 11 - 10:00 - Business Inventories
Charts of Interest: Tuesday and Thursday in separte post.
-----------------------------------------------------------------------------
This commentary and charts-of-interest are designed to stimulate thinking. This analysis is not a recommendation to buy, sell, hold or sell short any security (stock ETF or otherwise). We all need to think for ourselves when it comes to trading our own accounts. First, it is the only way to really learn. Second, we are the only ones responsible for our decisions. Think of these charts as food for further analysis. Before making a trade, it is important to have a plan. Plan the trade and trade the plan. Among other things, this includes setting a trigger level, a target area and a stop-loss level. It is also important to plan for three possible price movements: advance, decline or sideways. Have a plan for all three scenarios BEFORE making the trade. Consider possible holding times. And finally, look at overall market conditions and sector/industry performance.

About the author:
Arthur Hill, CMT, is the Chief Technical Strategist at TrendInvestorPro.com. Focusing predominantly on US equities and ETFs, his systematic approach of identifying trend, finding signals within the trend, and setting key price levels has made him an esteemed market technician. Arthur has written articles for numerous financial publications including Barrons and Stocks & Commodities Magazine. In addition to his Chartered Market Technician (CMT) designation, he holds an MBA from the Cass Business School at City University in London.
Learn More
