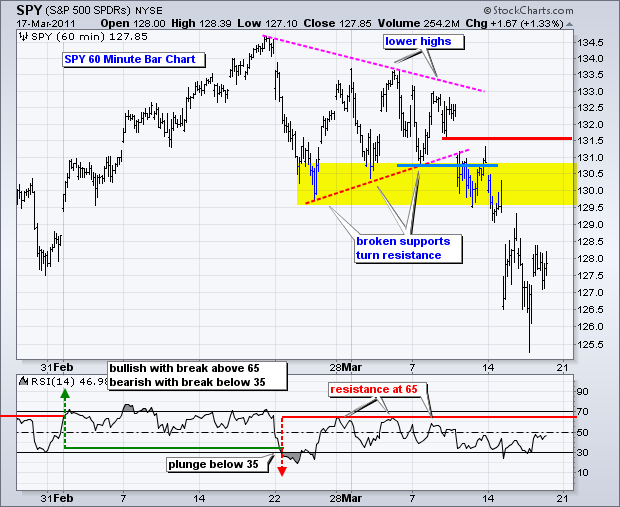
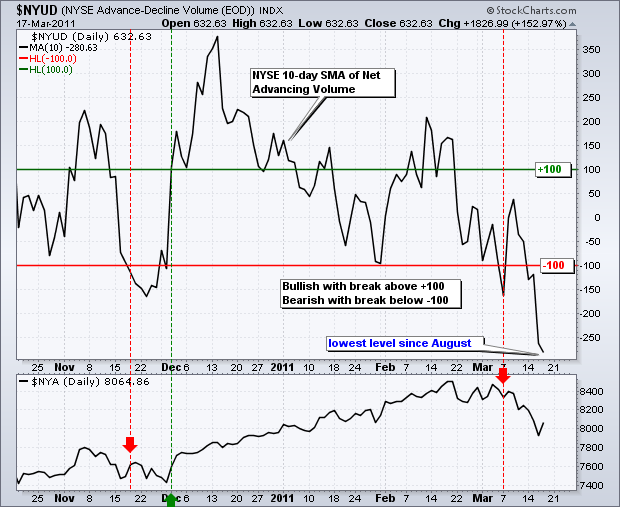
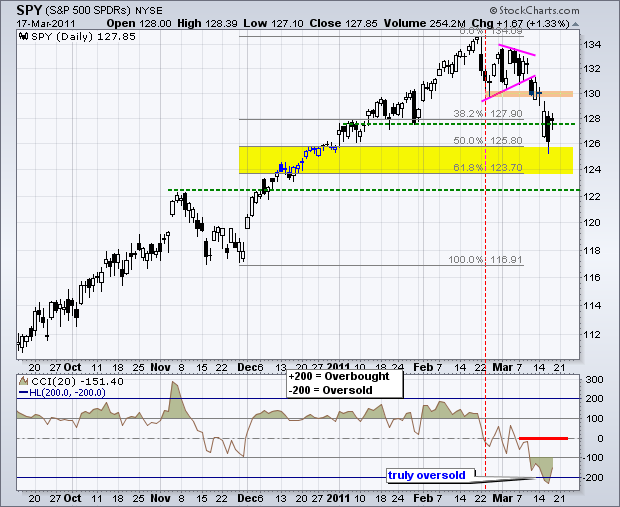
The analysis in this daily report on Art's Charts is short-term oriented, which can be from a few days to a few weeks. Medium and long-term analysis can be found in the Market Message, which is produced by John Murphy and myself. The Friday indicator summary on Art's Charts is medium-term oriented. As far as I am concerned, the medium-term and long-term trends for SPY remain up. The ETF just hit a new 52-week high in mid February and the current decline retraced around 50% of the December-February advance. Corrections after big advances are normal. We have yet to see a topping pattern (double top, head-and-shoulders) and the ETF has yet to break a major support level on the daily or weekly chart.


Key Economic Reports/Events:
None on Friday – TGIF.
Charts of Interest: Tuesday and Thursday in separate post.
-----------------------------------------------------------------------------
This commentary and charts-of-interest are designed to stimulate thinking. This analysis is not a recommendation to buy, sell, hold or sell short any security (stock ETF or otherwise). We all need to think for ourselves when it comes to trading our own accounts. First, it is the only way to really learn. Second, we are the only ones responsible for our decisions. Think of these charts as food for further analysis. Before making a trade, it is important to have a plan. Plan the trade and trade the plan. Among other things, this includes setting a trigger level, a target area and a stop-loss level. It is also important to plan for three possible price movements: advance, decline or sideways. Have a plan for all three scenarios BEFORE making the trade. Consider possible holding times. And finally, look at overall market conditions and sector/industry performance.


