Even though the indicator summary turned negative last week, I still viewed the recent decline as a correction within a bigger uptrend. We have yet to see a major topping pattern evolve and the market was entitled to a correction after a big run from late August to February. With a sharp surge over the last six trading days, a few indicators were upgraded and the indicator summary flipped back to positive again. June 2010 was the seen of prior whipsaws. At this point, the bulls were quick to show resilience and this should be respected until proven otherwise. See the About Page for more on Art's Charts and this indicator summary.
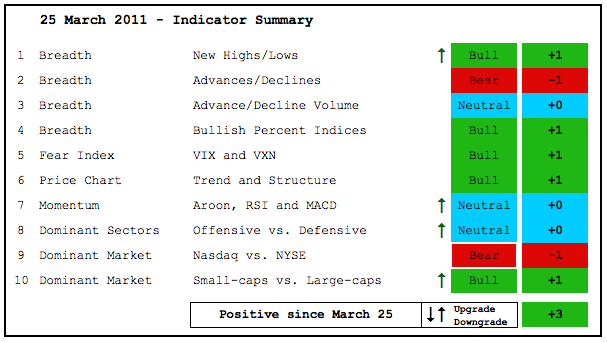
- AD Lines: Neutral. The Nasdaq AD Line broke support from the January lows, but the NYSE AD Line held and remains in an uptrend.
- AD Volume Lines: Bearish. The NYSE and Nasdaq AD Volume Lines broke below their January lows.
- Net New Highs: Bullish. The Nasdaq Cumulative Net New Highs Line dipped below its 10-day EMA, but bounced back above it this week. The NYSE Cumulative Net New Highs Line held above to remain bullish throughout.
- Bullish Percent Indices: Bullish. All BPIs remain above 50%.
- VIX/VXN: Bullish. The S&P 500 Volatility Index ($VIX) and the Nasdaq 100 Volatility Index ($VXN) both plunged below 22. The surge above 25 and sudden-sharp plunge suggests a big whipsaw (false breakout).
- Trend Structure: Bullish. DIA, QQQQ, IWM, SPY and MDY have yet to trace out a major reversal pattern (double top, head-and-shoulders). All recorded new 52-week highs in mid February and are entitled to a correction.
- SPY Momentum: Neutral. MACD(5,35,5) moved back to the zero line and RSI surged back above 50. These sharp reverses suggest that the prior declines were whipsaws. Aroon broke below -50 for the first time since May and remains below -50.
- Offensive Sector Performance: Neutral. Industrials and consumer discretionary remain strong, but technology and finance have been relatively weak since January.
- Nasdaq Performance: Bearish. The Nasdaq has been underperforming the NY Composite ($NYA) since early January.
- Small-cap Performance: Bullish. Small-caps have been outperforming the last eight weeks. Even though the $RUT:$OEX Ratio is below its December high, I will respect the uptrend as long as the late February low holds.
- Breadth Charts (here) and Inter-market charts (here) have been updated
This table is designed to offer an objective look at current market conditions. It does not aim to pick tops or bottoms. Instead, it seeks to identify noticeable shifts in buying and selling pressure. With 10 indicator groups, the medium-term evidence is unlikely to change drastically overnight.

Previous turns include:
Positive on 11-Sept-09
Negative on 5-Feb-10
Positive on 5-March-10
Negative on 11-Jun-10
Positive on 18-Jun-10
Negative on 24-Jun-10
Positive on 6-Aug-10
Negative on 13-Aug-10
Positive on 3-Sep-10
Negative on 18-Mar-11
Positive on 25-Mar-11


