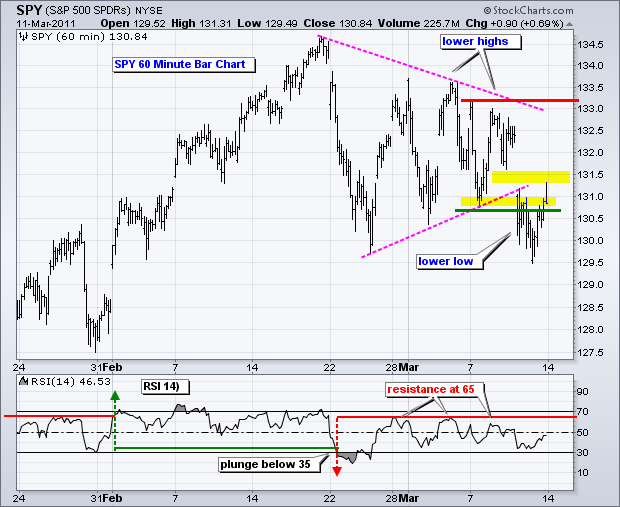
The majority of the short-term evidence remains bearish. Bearish evidence started building when RSI on the 30-minute chart plunged below 30 on February 22nd. Despite a few sharp bounces, the indicator never made it back above 65 and remains in bear mode. Bearish evidence expanded when short-term breadth broke down on March 7th. The Nasdaq breadth indicators turned bearish on February 23rd and the NYSE indicators confirmed on March 7th. Despite these bearish indications, the S&P 500 was locked in a trading range (triangle) until the gap down and support break on March 10th. The duration and path of this short-term downtrend are really indeterminable. We can look for support levels based on prior reaction lows and key retracements for potential reversal or bounce points. A full short-term trend reversal would require bullish signals from the big three indicators: RSI, breadth and price action.
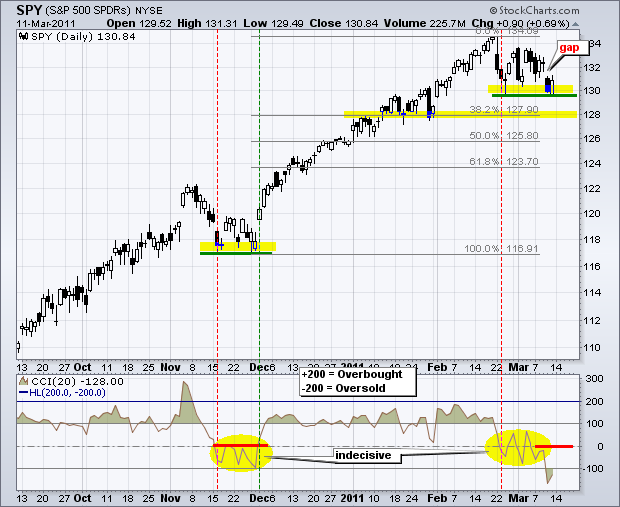
On the daily chart, SPY found support from the late February lows and closed above 130 on Friday. While I still see some similarities between late November and now, SPY has yet to produce a short-term bullish breakout or surge that would suggest an extended move higher, such as in early December. Thursday's gap remains unfilled and CCI remains in negative territory. As far as downside targets, the 38% retracement and broken-resistance-turned-support point to the 128 area.

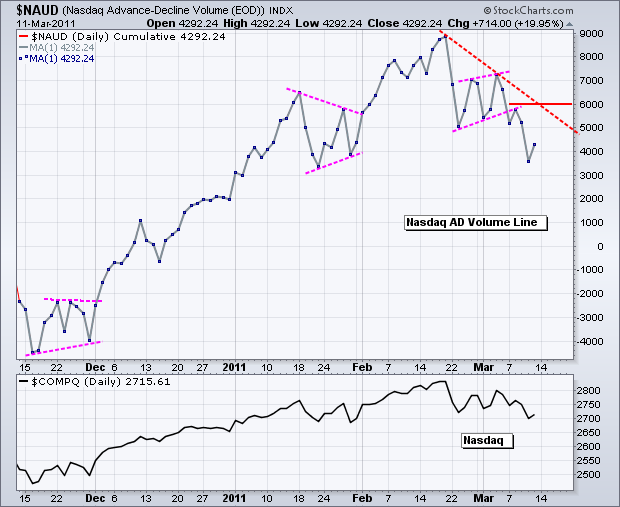
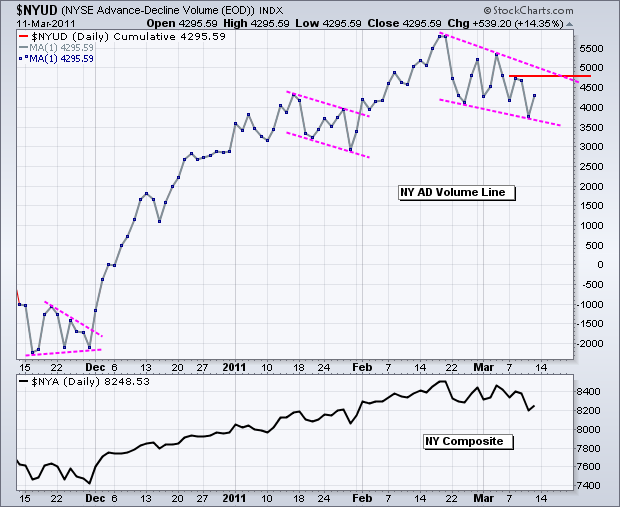
The two breadth charts below show the AD Volume Lines for the Nasdaq and NYSE. The Nasdaq AD Volume Line broke flag/wedge support with a sharp decline last Monday. The trend since mid February remains down with resistance at 6000 (last Tuesday's high). The NYSE AD Volume Line sports a falling wedge over the last four weeks. This short-term trend is clearly down as long as the wedge falls. A break above last week's high is needed to turn breadth bullish again.


Key Economic Reports/Events:
Tue - Mar 15 - 08:30 – Empire State Manufacturing
Tue - Mar 15 - 10:00 - NAHB Housing Market Index
Tue - Mar 15 - 14:15 - FOMC Policy Statement
Wed - Mar 16 - 07:00 - MBA Mortgage Index
Wed - Mar 16 - 08:30 - Housing Starts & Building Permits
Wed - Mar 16 - 08:30 - PPI
Wed - Mar 16 - 10:30 - Oil Inventories
Thu - Mar 17 - 08:30 - Jobless Claims
Thu - Mar 17 - 08:30 - CPI
Thu - Mar 17 - 09:15 - Industrial Production
Thu - Mar 17 - 10:00 - Leading Indicators
Thu - Mar 17 - 10:00 - Philadelphia Fed
Thu – Mar 17 – 18:00 – St Patrick's Day Evening!
Charts of Interest: Tuesday and Thursday in separate post.
-----------------------------------------------------------------------------
This commentary and charts-of-interest are designed to stimulate thinking. This analysis is not a recommendation to buy, sell, hold or sell short any security (stock ETF or otherwise). We all need to think for ourselves when it comes to trading our own accounts. First, it is the only way to really learn. Second, we are the only ones responsible for our decisions. Think of these charts as food for further analysis. Before making a trade, it is important to have a plan. Plan the trade and trade the plan. Among other things, this includes setting a trigger level, a target area and a stop-loss level. It is also important to plan for three possible price movements: advance, decline or sideways. Have a plan for all three scenarios BEFORE making the trade. Consider possible holding times. And finally, look at overall market conditions and sector/industry performance.


