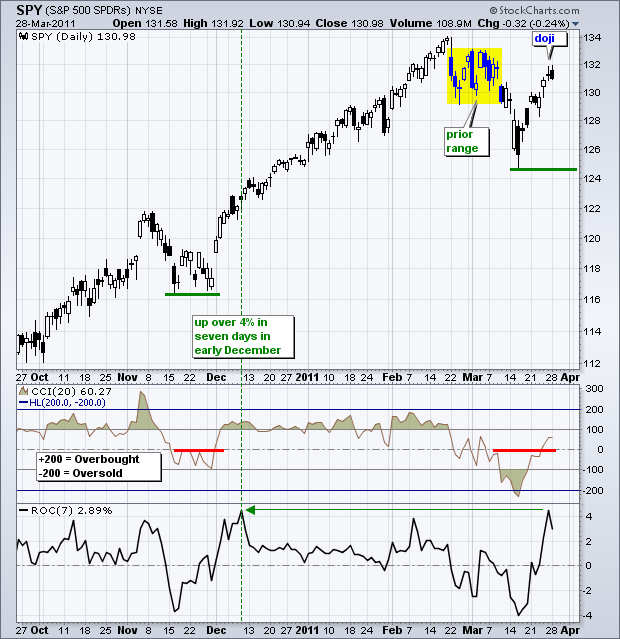
The medium-term trend has been up since early September and the short-term trend turned up again with last week's break above 130. After a 4.51% run the prior seven days, the S&P 500 ETF (SPY) became short-term overbought and is now showing signs of indecision. Friday's doji and Monday's small black candlestick formed in the middle of the prior trading range (yellow box). This congestion zone could generate some resistance.

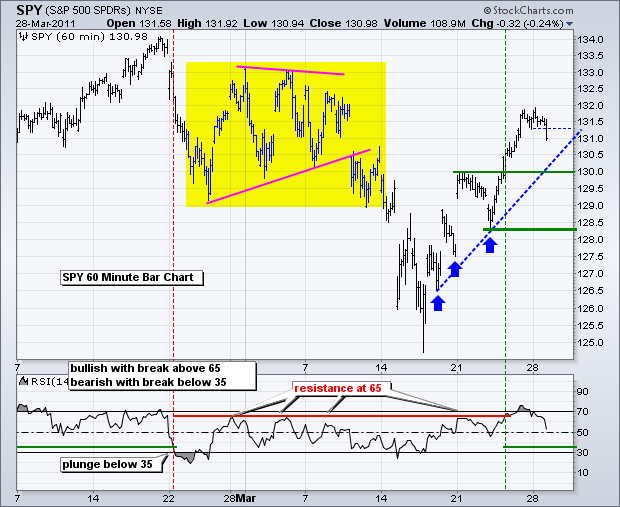
On the 60-minute chart, the uptrend started with three gaps and these three gaps held for the most part. Buying pressure picked up right after each post-gap pullback (blue arrows). Broken resistance turns into the first support level at 130. There is no sense fighting this short-term uptrend as long as 130 holds. For now, I am leaving key support at 128.30. The employment report is scheduled for Friday morning. In the meantime, we have a few other employment related releases on Wednesday-Thursday. Stocks have shown a propensity to move before this report with big moves often coming the Thursday before. Employment Friday's have been the calm after the storm of late.

Key Economic Reports/Events:
Tue - Mar 29 - 09:00 - Case-Shiller Index
Tue - Mar 29 - 10:00 - Consumer Confidence
Wed - Mar 30 - 07:00 - MBA Mortgage Index
Wed - Mar 30 - 07:30 - Challenger Job Cuts
Wed - Mar 30 - 08:15 - ADP Employment Change
Wed - Mar 30 - 10:30 – Oil Inventories
Thu - Mar 31 - 08:30 - Jobless Claims
Thu - Mar 31 - 09:45 - Chicago PMI
Thu - Mar 31 - 10:00 - Factory Orders
Fri - Apr 01 - 08:30 - Employment Report
Fri - Apr 01 - 10:00 - ISM Index
Fri - Apr 01 - 10:00 - Construction Spending
Fri - Apr 01 - 15:00 - Auto-Truck Sales
Charts of Interest: Tuesday and Thursday in separate post.
-----------------------------------------------------------------------------
This commentary and charts-of-interest are designed to stimulate thinking. This analysis is not a recommendation to buy, sell, hold or sell short any security (stock ETF or otherwise). We all need to think for ourselves when it comes to trading our own accounts. First, it is the only way to really learn. Second, we are the only ones responsible for our decisions. Think of these charts as food for further analysis. Before making a trade, it is important to have a plan. Plan the trade and trade the plan. Among other things, this includes setting a trigger level, a target area and a stop-loss level. It is also important to plan for three possible price movements: advance, decline or sideways. Have a plan for all three scenarios BEFORE making the trade. Consider possible holding times. And finally, look at overall market conditions and sector/industry performance.


