One must wonder how stocks can continue to gain in the current environment. Oil, gold and the Euro are going to the moon. Bonds broke down last week to signal a resumption of their long-term downtrend, which means interest rates are heading higher. Perhaps QE2 and the Fed's POMO (Permanent Open Market Operations) are still ruling the roost. Who is to say what is permanent and what is not. There are, however, signals coming from Fed members that the asset purchase program will end in June. As a forward-looking beast that is clearly overbought, the stock market may just find a way to peak before this program ends.
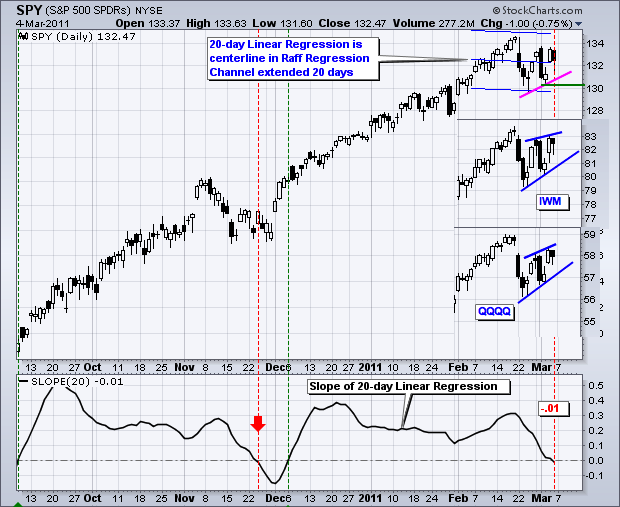
Turning bearish now, even short-term, is still a top picking exercise. The overall trend on the daily chart remains up. SPY and its cousins hit fresh 52-week highs two weeks ago and have yet to break important support levels. Currently, SPY is caught between two gaps. The 22-Feb gap down marks resistance and Thursday's gap up marks support. A lower high could be taking shape and a break below last week's lows would be short-term bearish.

Some signs of trend weakness are also appearing in the 20-day Slope indicator, which turned negative for the first time since early December. The 20-day Slope means the slope (rise/run) of a 20-day Linear Regression, which is the line of best fit for the last 20 trading days (closing prices). Also note that the Nasdaq 100 ETF (QQQQ) and S&P MidCap 400 SPDR (MDY) formed rising wedges over the last two weeks. All eyes are on last week's lows as first support.
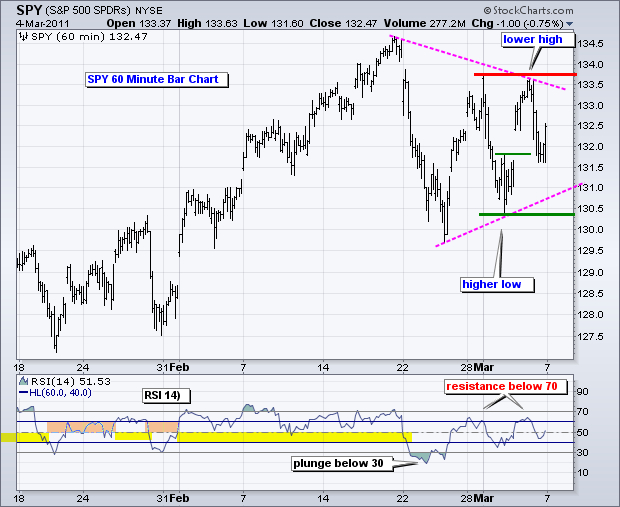
The 60-minute chart remains a mess as SPY gyrates within a triangle formation. Negative lower highs are matched with positive higher lows. The first break from this pattern will trigger the next directional signal. In fact, last week's high-low range marks resistance-support. RSI is following the SPY lead with a trading range as well. Of note, RSI did plunge below 30 in late February, which is more typical of downtrends than uptrends. Also notice that RSI is meeting resistance below 70. Surges above 70 are more indicative of uptrends. Even though RSI broke above 60 last week, an overview of the last three weeks makes this indicator (momentum) look more bearish than bullish.

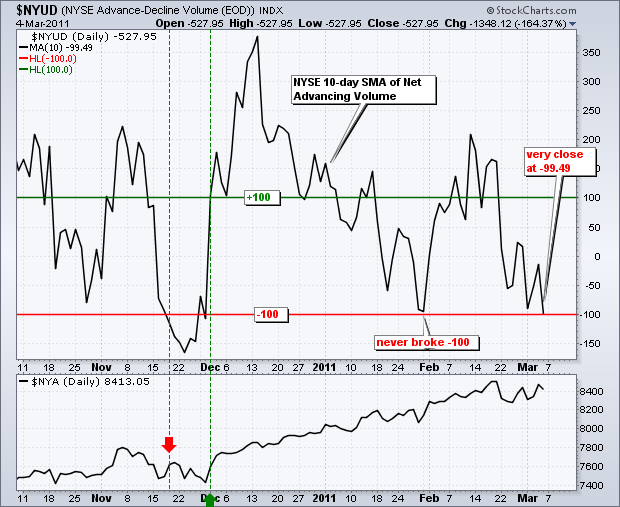
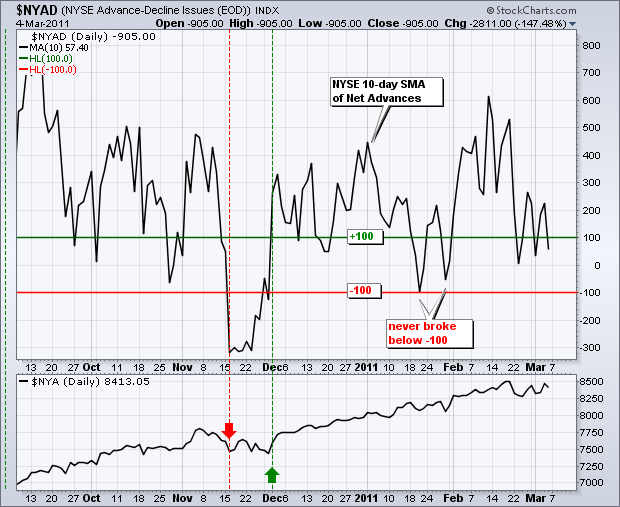
Short-term breadth is on the verge of turning bearish. The 10-day SMAs for Nasdaq Net Advances ($NAAD) and Nasdaq Net Advancing Volume ($NAUD) both moved below -100 at least three times in the last three weeks. These two indicators are short-term bearish. However, the 10-day SMAs for the NYSE Net Advances ($NYAD) and NYSE Net Advancing Volume ($NYUD) have yet to break the -100 level. Both of these remain in bull mode. In the absence of a bearish majority (3 of 4) for a bearish breadth reversal, I will defer to the prior bullish signals in early December. All four indicators turned bullish in early December. Nasdaq breadth turned bearish in late January, but these bearish signals were not confirmed with the NYSE breadth indicators. It takes a full bearish majority to reverse a bullish signal. A strong decline this week would likely turn the NYSE indicators bearish and trigger a bearish majority.


Key Economic Reports/Events:
Wed - Mar 09 - 07:00 - MBA Mortgage Index
Wed - Mar 09 - 10:30 - Crude Inventories
Thu - Mar 10 - 08:30 - Jobless Claims
Fri - Mar 11 - 08:30 - Retail Sales
Fri - Mar 11 - 09:55 - Michigan Sentiment
Fri - Mar 11 - 10:00 - Business Inventories
Charts of Interest: Tuesday and Thursday in separate post.
-----------------------------------------------------------------------------
This commentary and charts-of-interest are designed to stimulate thinking. This analysis is not a recommendation to buy, sell, hold or sell short any security (stock ETF or otherwise). We all need to think for ourselves when it comes to trading our own accounts. First, it is the only way to really learn. Second, we are the only ones responsible for our decisions. Think of these charts as food for further analysis. Before making a trade, it is important to have a plan. Plan the trade and trade the plan. Among other things, this includes setting a trigger level, a target area and a stop-loss level. It is also important to plan for three possible price movements: advance, decline or sideways. Have a plan for all three scenarios BEFORE making the trade. Consider possible holding times. And finally, look at overall market conditions and sector/industry performance.


