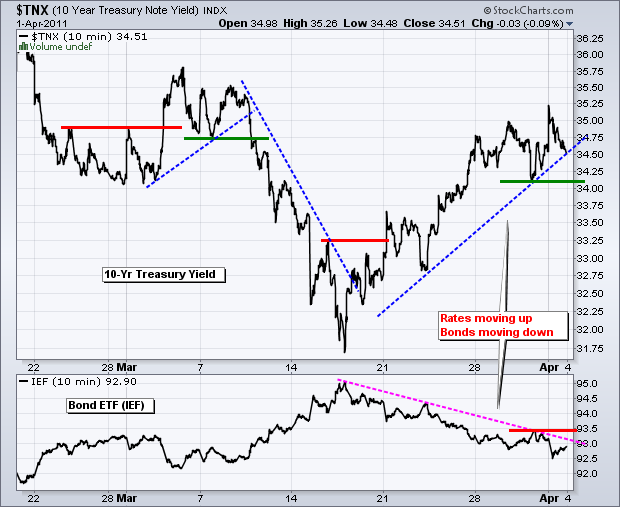
There are some well-defined short-term trends working over the last three weeks or so. Interest rates are moving up as bonds move lower. Oil is moving higher and the Dollar is moving lower. Stocks are trending up with small-caps leading the way. While we cannot always assume that correlation is causation, it is a pretty good bet that these trends are related and changes in one would affect the others.
The first chart shows the 10-year Treasury Yield ($TNX) with a "V" bottom and surge above 3.5% (35) last week. The low around 34 marks first support. Conversely, the 7-10 year Bond ETF (IEF) is trending lower with key resistance at 93.5. Stocks seem to like rising rates and falling bonds. Money moving out of bonds has to go somewhere. Rising rates also point to strength in the economy, which is positive for stocks.
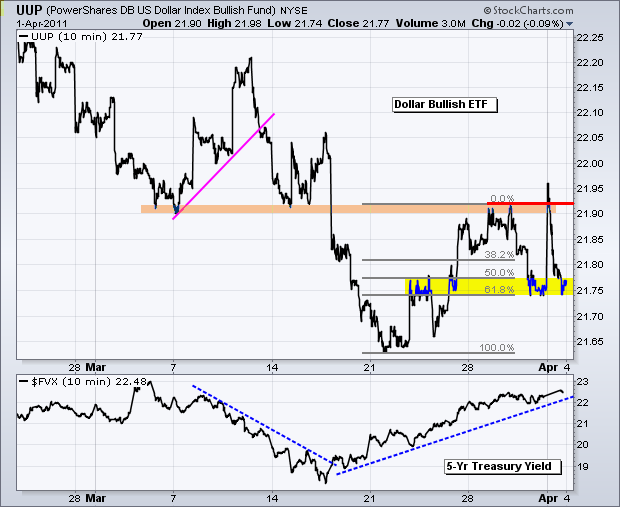
The US Dollar Fund (UUP) bottomed on March 21st and appeared to be breaking higher early Friday, but selling pressure hit the Dollar hard and the ETF declined all the way back to support. Resistance around 21.92 stems from broken supports and the late March highs. A move back above 21.92 would be quite positive. UUP is also at a potential support level around 21.75. This level stems from broken resistance and the 62% retracement. Admittedly, the big trend is down since early January and a short-term breakdown here would signal yet another continuation lower.
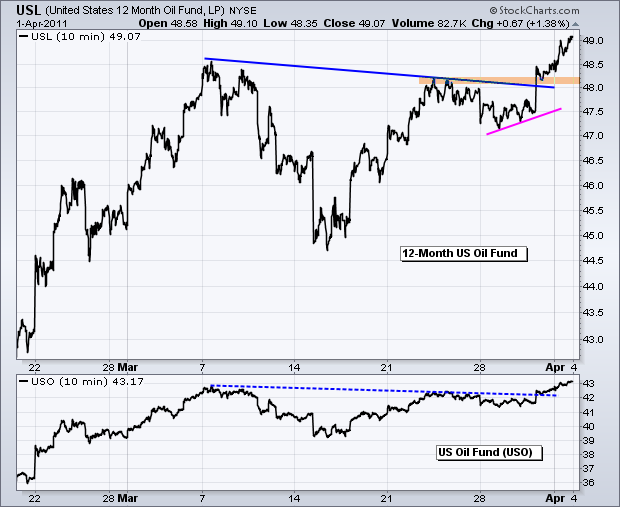
The 12-Month US Oil Fund (USL) broke consolidation resistance with a surge above 48 last week. There is certainly no sign of weakness on this chart. Strength in oil points to strength in demand for energy products. Supply concerns could be an issue with recent events in North Africa and the Middle East. However, I think economic strength and Dollar weakness are the real drivers.
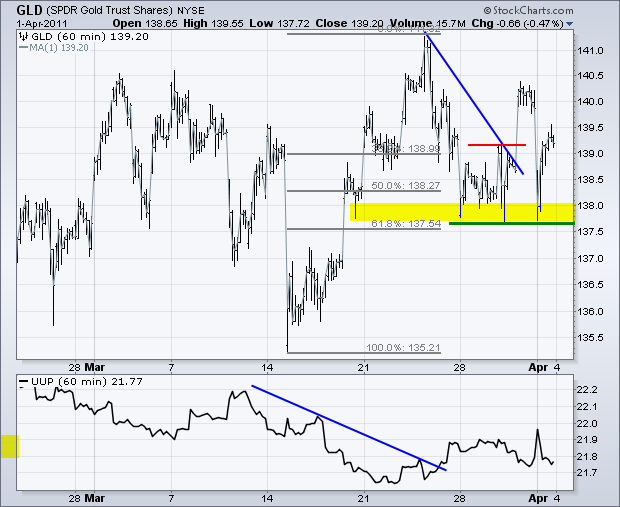
The Gold SPDR (GLD) found support in the 138 area early last week and surged above short-term resistance with a big move on Thursday. This move did not hold as bullion plunged back to support early Friday. Support is still holding and the bulls have control of the short-term trend. A break below last week's lows would be short-term bearish for gold.
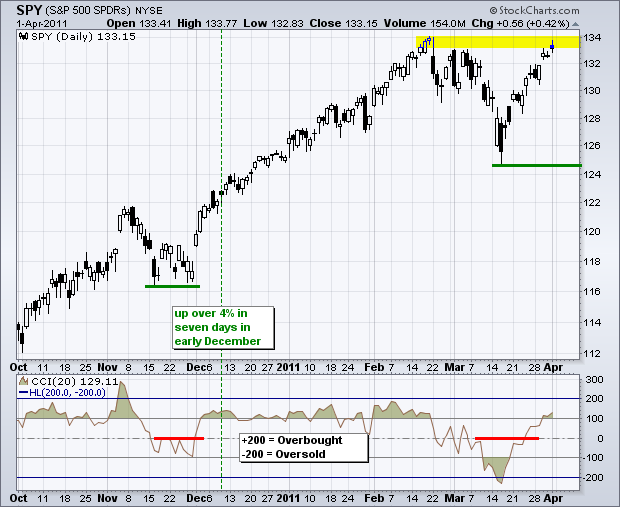
Turning to stocks, the Russell 2000 ETF and S&P MidCap 400 SPDR both broke above their February highs and recorded fresh 52-week highs last week. It is positive to see relative strength from small and mid-caps. The S&P 500 ETF (SPY) is trading near its February high. Candlestick action has turned indecisive the last three days. Notice the doji on Thursday and the small spinning tops on Wednesday and Friday. Nevertheless, Wednesday's gap is holding and this is the first area to watch for a failure near the February highs.
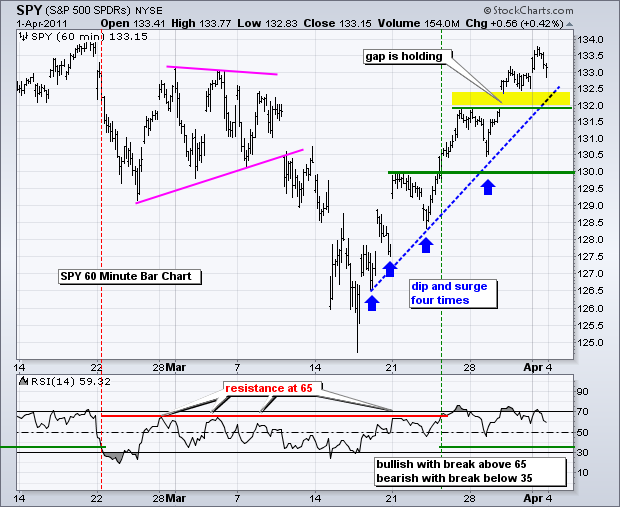
On the 60-minute chart, there is no denying the uptrend since mid March. SPY gapped above 132 on Wednesday and this gap is holding. A move below 132 would break the blue trendline and fill the gap. This would be negative, but I will hold off on turning short-term bearish for two reasons. First, the medium-term (bigger) trend is up. Second, stocks are entitled to a pullback after 6+ percent run the last three weeks. Key support remains at 130 for now.
Key Economic Reports/Events:
Tue - Apr 05 - 10:00 - ISM Services
Tue - Apr 05 - 14:00 - Fed Minutes
Wed - Apr 06 - 07:00 - MBA Mortgage Index
Wed - Apr 06 - 10:30 - Oil Inventories
Thu - Apr 07 - 08:30 - Jobless Claims
Thu - Apr 07 - 15:00 - Consumer Credit
Fri - Apr 08 - 10:00 - Wholesale Inventories
Charts of Interest: Tuesday and Thursday in separate post.
-----------------------------------------------------------------------------
This commentary and charts-of-interest are designed to stimulate thinking. This analysis is not a recommendation to buy, sell, hold or sell short any security (stock ETF or otherwise). We all need to think for ourselves when it comes to trading our own accounts. First, it is the only way to really learn. Second, we are the only ones responsible for our decisions. Think of these charts as food for further analysis. Before making a trade, it is important to have a plan. Plan the trade and trade the plan. Among other things, this includes setting a trigger level, a target area and a stop-loss level. It is also important to plan for three possible price movements: advance, decline or sideways. Have a plan for all three scenarios BEFORE making the trade. Consider possible holding times. And finally, look at overall market conditions and sector/industry performance.


