Even though the finance sector remains a laggard, newfound relative strength in technology is picking up the slack. Led by semis, the Nasdaq and the Technology ETF (XLK) surged almost 5% the last seven trading days. Renewed leadership from techs is a positive for the market overall. There is some concern that the Nasdaq AD Line and AD Volume Line have yet to confirm new highs in the Nasdaq. Also notice that the NYSE AD Volume Line has yet to confirm new highs in the NY Composite. These breadth indicators are, however, close to their prior highs and do not show any material weakness. More details on Art's charts can be found on the About Page.

- AD Lines: Neutral. The Nasdaq is trading at a 52-week high, but the AD Line remains below its February and March highs. The NY Composite and NYSE AD Line moved to new 52-week highs this week.
- AD Volume Lines: Neutral. The Nasdaq and NY Composite both moved to new 52-week highs, but their respective AD Volume Lines have yet to break above their February highs. Both are close, but no cigar just yet.
- Net New Highs: Bullish. Nasdaq Net New Highs diminished quite a bit in April, but remain positive overall and the cumulative Net New Highs line moved to another new high. NYSE Net New Highs remain strong and the Cumulative Net New Highs line moved to new highs as well.
- Bullish Percent Indices: Bullish. All BPIs remain above 50%.
- VIX/VXN: Bullish. The S&P 500 Volatility Index ($VIX) and the Nasdaq 100 Volatility Index ($VXN) are both well below 20. The fear factor is low and this is positive for stocks.
- Trend Structure: Bullish. The major index ETFs (DIA, IWM, MDY, QQQ and SPY) recorded 52-week highs in April.
- SPY Momentum: Bullish. RSI held the 40-50 zone in mid April and surged. MACD held just above the zero line in mid April and surged. Aroon moved back into positive territory.
- Offensive Sector Performance: Bullish. The Consumer Discretionary SPDR (XLY) and the Industrials SPDR (XLI) both hit 52-week highs this week. The Technology ETF (XLK) also surged with a big gap and move above its early March high. Even though the Finance SPDR (XLF) is still lagging though, 3 of 4 are looking strong enough.
- Nasdaq Performance: Bullish. The Nasdaq has been outperforming the NY Composite since mid March. It is not for a long time, but the $COMPQ:$NYA ratio broke a trendline extending down from January and exceeded its March highs. Techs are starting to show relative strength.
- Small-cap Performance: Bullish. Small-caps have been outperforming since 24-January and the Price Relative ($RUT:$OEX) hit a 52-week high in early April.
- Breadth Charts (here) and Inter-market charts (here) have been updated
This table is designed to offer an objective look at current market conditions. It does not aim to pick tops or bottoms. Instead, it seeks to identify noticeable shifts in buying and selling pressure. With 10 indicator groups, the medium-term evidence is unlikely to change drastically overnight.
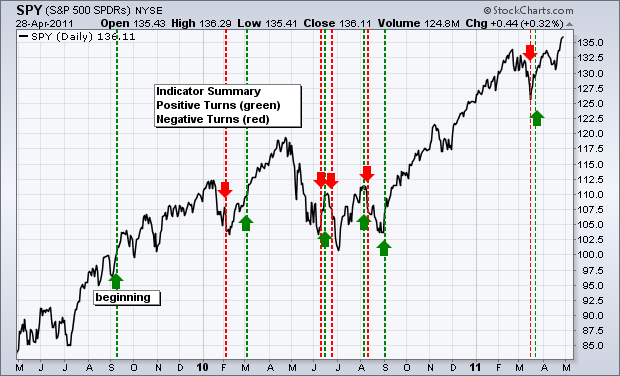
Previous turns include:
Positive on 11-Sept-09
Negative on 5-Feb-10
Positive on 5-March-10
Negative on 11-Jun-10
Positive on 18-Jun-10
Negative on 24-Jun-10
Positive on 6-Aug-10
Negative on 13-Aug-10
Positive on 3-Sep-10
Negative on 18-Mar-11
Positive on 25-Mar-11


