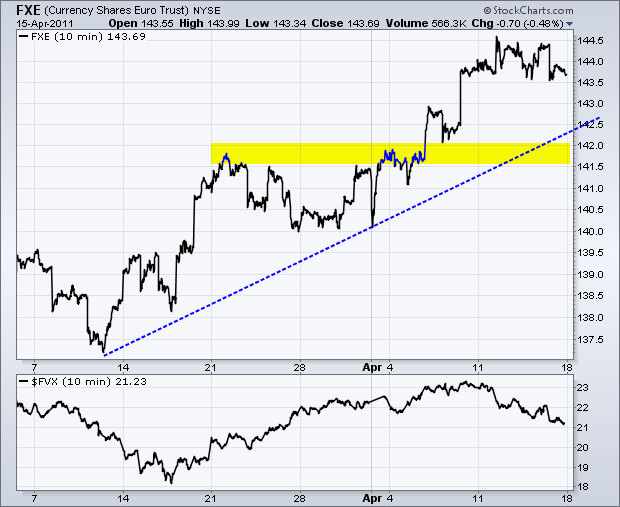
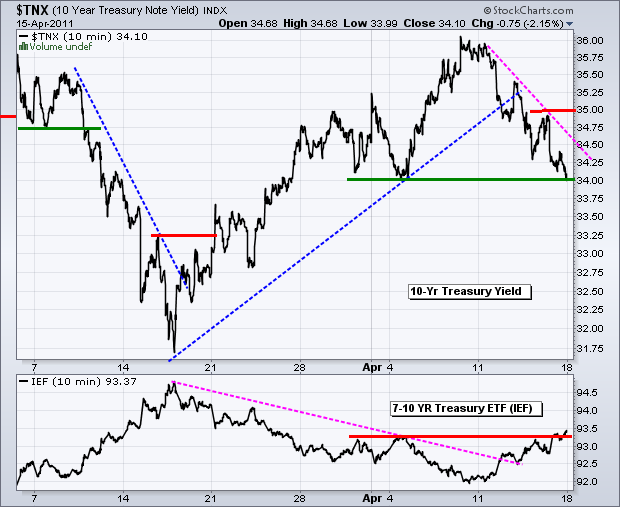
There are a few negatives working against the stock market right now. First, bonds have been rising and yields falling - even though inflationary pressures appear to be building. Despite gold and the Inflation Indexed Bond ETF (TIP) moving to new 2011 highs last week, normal bonds were also strong. The 20+ year Bond ETF (TLT) formed an outside reversal last week and surged 3.1%. The chart below shows the 10-year Treasury Yield ($TNX) moving all the way to its early April lows and the 7-10 year Bond ETF (IEF) breaking above its early April highs. With bonds and stocks inversely correlated for some time now, the recent rise in bond prices is negative for stocks.

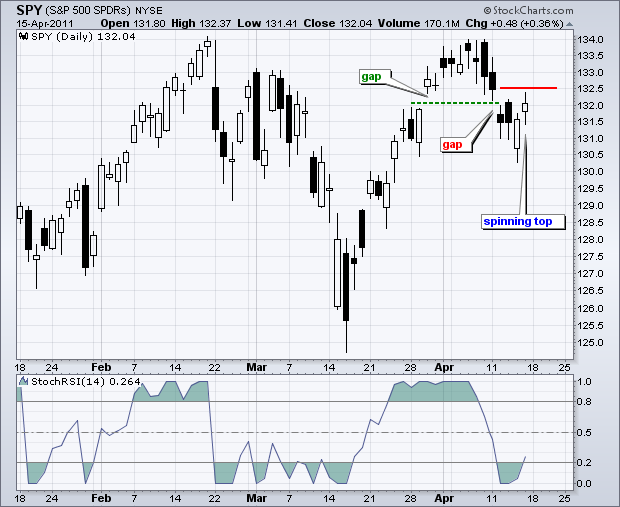
Turning to SPY, the ETF bounced back into the gap zone on Friday, but ended the day with an indecisive spinning top candlestick. Indecision in the gap-resistance zone could lead to more weakness. StochRSI moved from oversold levels, but did not break into the upper half of its range (>.50) to put short-term momentum in bull mode.

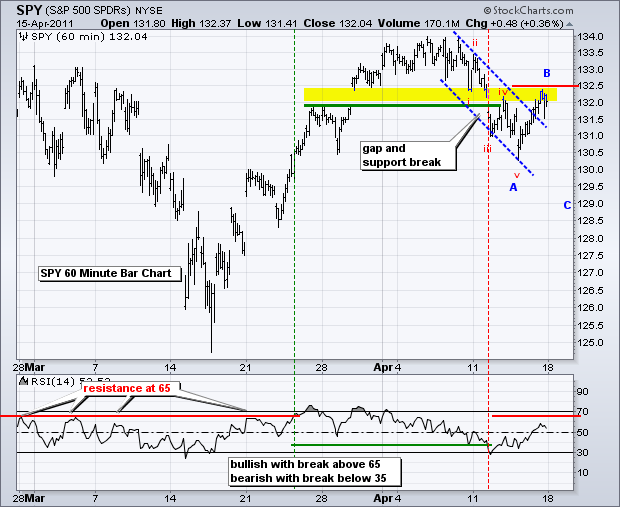
On the 60-minute chart, the decline to 130.5 traced out a clear 5-wave sequence. If this is part of a larger decline, then we can expect either an ABC correction to form or the start of a bigger five wave decline. ABC corrections form with 5 waves down, 3 up and 5 down. While I cannot see a 3-wave bounce on the SPY chart, the June S&P 500 E-mini did trace out a clear 3-wave bounce from Thursday morning to Friday afternoon. Throw in gap resistance and this means the smaller corrective wave (B) is complete. A 5-Wave C is now expected to complete the bigger correction (ABC). The first Wave C target would be 129. The length of Wave A is subtracted from the high of Wave B for a target.

Key Economic Reports/Events:
Apr 19 08:30 Housing Starts/Building Permits
Apr 20 07:00 MBA Mortgage Purchase Index
Apr 20 10:00 Existing Home Sales
Apr 20 10:30 Oil Inventories
Apr 21 08:30 Jobless Claims
Apr 21 10:00 Philadelphia Fed
Apr 21 10:00 Leading Indicators
Charts of Interest: Tuesday and Thursday in separate post.
-----------------------------------------------------------------------------
This commentary and charts-of-interest are designed to stimulate thinking. This analysis is not a recommendation to buy, sell, hold or sell short any security (stock ETF or otherwise). We all need to think for ourselves when it comes to trading our own accounts. First, it is the only way to really learn. Second, we are the only ones responsible for our decisions. Think of these charts as food for further analysis. Before making a trade, it is important to have a plan. Plan the trade and trade the plan. Among other things, this includes setting a trigger level, a target area and a stop-loss level. It is also important to plan for three possible price movements: advance, decline or sideways. Have a plan for all three scenarios BEFORE making the trade. Consider possible holding times. And finally, look at overall market conditions and sector/industry performance.


