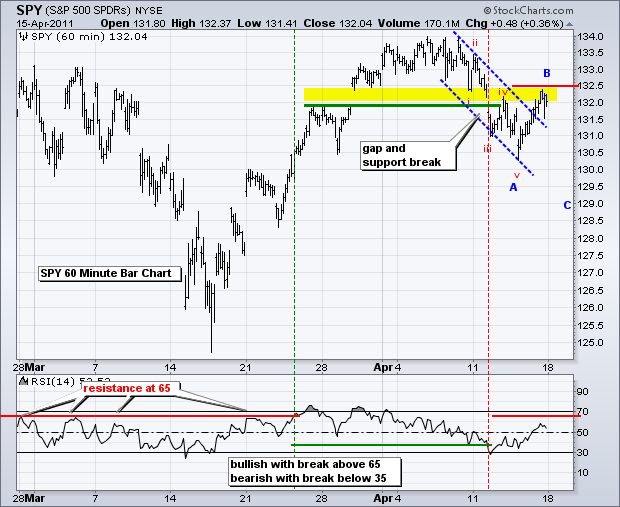
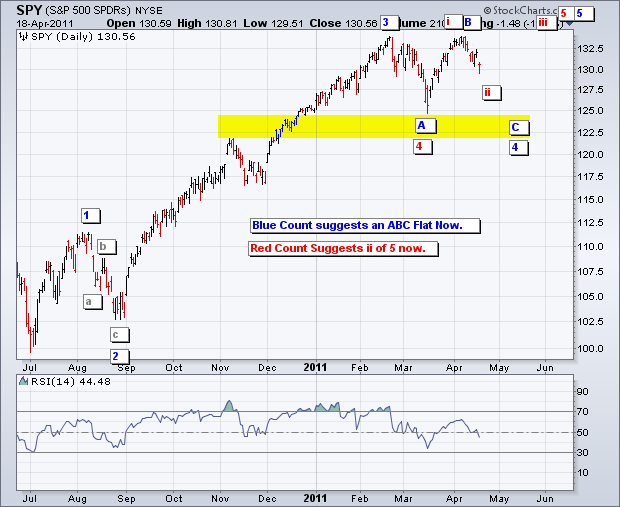
Before diving headfirst into some Elliott wave counts, please note that the overall trends take precedent. The overall trend on the daily chart (medium-term) remains up and the overall trend on the 60-minute chart (short-term) remains down. There are, at least, two Elliott counts possible on the S&P 500 ETF (SPY) chart. The blue letters suggest that the February peak marked the end of Wave 3 and an ABC Flat is unfolding now. The April peak marks the end of Wave B and we now have Wave C underway. The downside target on the daily chart is the support zone around 122.5-124 (yellow). The second count (red) suggests that the March low marks the end of the Wave 4 correction and the advance to the early April high is Wave i of a bigger Wave 5. With the current pullback over the last eight days, SPY is currently in Wave ii of Wave 5. This implies that Wave ii should end above the March low and we should then expect Wave iii of 5 higher. Regardless of the wave count, we must still use some basic trend analysis to identify the end of Wave ii and the beginning of wave iii. Yes, at the end of the day, it all boils down to basic trend analysis.

Key Economic Reports/Events:
Apr 19 08:30 Housing Starts/Building Permits
Apr 20 07:00 MBA Mortgage Purchase Index
Apr 20 10:00 Existing Home Sales
Apr 20 10:30 Oil Inventories
Apr 21 08:30 Jobless Claims
Apr 21 10:00 Philadelphia Fed
Apr 21 10:00 Leading Indicators
Charts of Interest: Tuesday and Thursday in separate post.
-----------------------------------------------------------------------------
This commentary and charts-of-interest are designed to stimulate thinking. This analysis is not a recommendation to buy, sell, hold or sell short any security (stock ETF or otherwise). We all need to think for ourselves when it comes to trading our own accounts. First, it is the only way to really learn. Second, we are the only ones responsible for our decisions. Think of these charts as food for further analysis. Before making a trade, it is important to have a plan. Plan the trade and trade the plan. Among other things, this includes setting a trigger level, a target area and a stop-loss level. It is also important to plan for three possible price movements: advance, decline or sideways. Have a plan for all three scenarios BEFORE making the trade. Consider possible holding times. And finally, look at overall market conditions and sector/industry performance.


