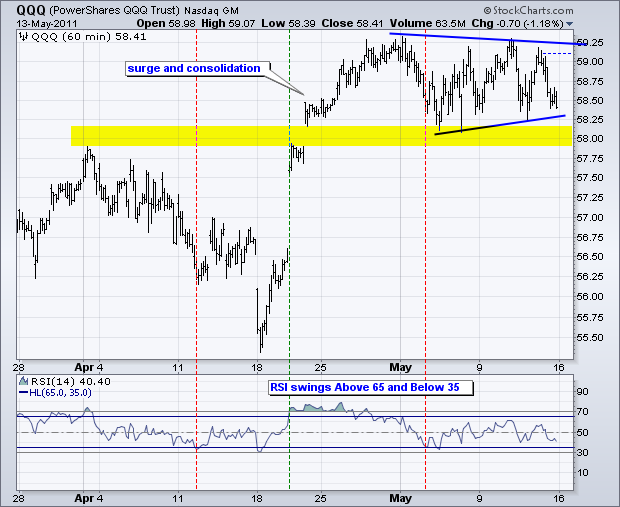
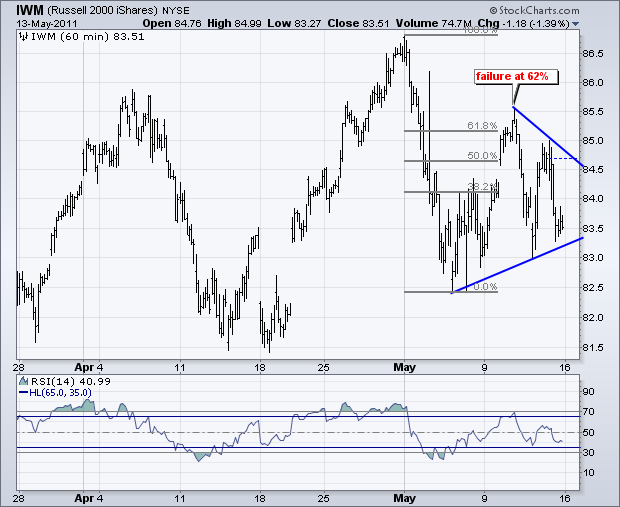
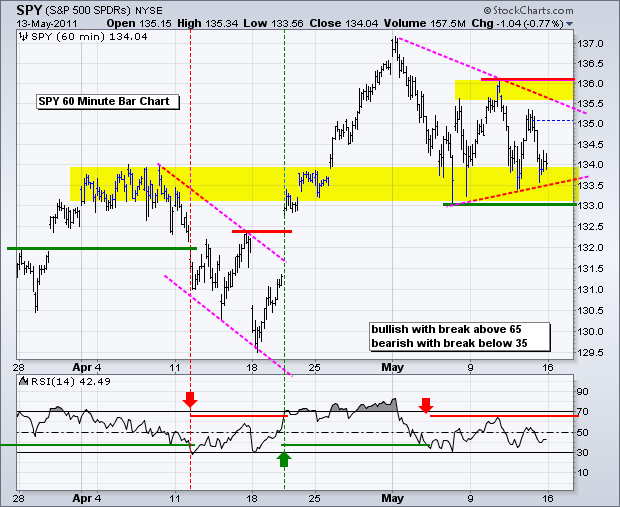
Today we will just go straight to the 60-minute charts to review the current consolidations in the Nasdaq 100 ETF (QQQ), Russell 2000 ETF (IWM) and S&P 500 ETF (SPY). Stocks became overbought after surging from mid April to early May. These overbought conditions were worked off with the sideways patterns of the last two weeks. A consolidation after a surge is often a bullish continuation pattern, similar to flags and pennants. This means upside breakouts would signal a continuation of the prior advances. After Friday's pullback, the major index ETFs are trading near consolidation support, which makes the risk-reward ratio for new longs favorable. This is the challenge with consolidations. It is temping to lean bearish when near the top of the consolidation (resistance) and lean bullish near the bottom. There will be a break one day, we just can never be sure when. Moreover, there is also a chance of a downside break. Commentary continues below the IWM chart.


The markets saw a return of the risk-off trade over the last two weeks. The Euro plunged, the Dollar surged, stocks weakened, commodities moved lower and bonds moved higher. The six month seasonal pattern also turned negative in May and runs until the end of October. The finance sector remains relatively weak and banks continue to lag the rest of the market. Stocks are also ripe for at least a correction after big runs that started in late August. Short-term momentum is also in the bearish camp. RSI for SPY moved below 35 to turn bearish on May 4th and failed at the top of the bear zone last week (65). StochRSI on the daily chart moved below .20 for the first time since mid April. A break below consolidation support in the major index ETFs would argue for a continuation of the early May decline and a deeper correction.
Key Economic Reports/Events:
Mon - May 16 - 08:30 - Empire Manufacturing
Mon - May 16 - 10:00 - NAHB Housing Market Index
Tue - May 17 - 08:30 - Housing Starts/Building Permit
Tue - May 17 - 09:15 - Industrial Production
Wed - May 18 - 07:00 - MBA Mortgage Index
Wed - May 18 - 10:30 - Oil Inventories
Wed - May 18 - 14:00 - FOMC Minutes
Thu - May 19 - 08:30 - Jobless Claims
Thu - May 19 - 10:00 - Existing Home Sales
Thu - May 19 - 10:00 - Philadelphia Fed
Thu - May 19 - 10:00 - Leading Indicators
Charts of Interest: Tuesday and Thursday in separate post.
***********************************************
This commentary and charts-of-interest are designed to stimulate thinking. This analysis is not a recommendation to buy, sell, hold or sell short any security (stock ETF or otherwise). We all need to think for ourselves when it comes to trading our own accounts. First, it is the only way to really learn. Second, we are the only ones responsible for our decisions. Think of these charts as food for further analysis. Before making a trade, it is important to have a plan. Plan the trade and trade the plan. Among other things, this includes setting a trigger level, a target area and a stop-loss level. It is also important to plan for three possible price movements: advance, decline or sideways. Have a plan for all three scenarios BEFORE making the trade. Consider possible holding times. And finally, look at overall market conditions and sector/industry performance.


