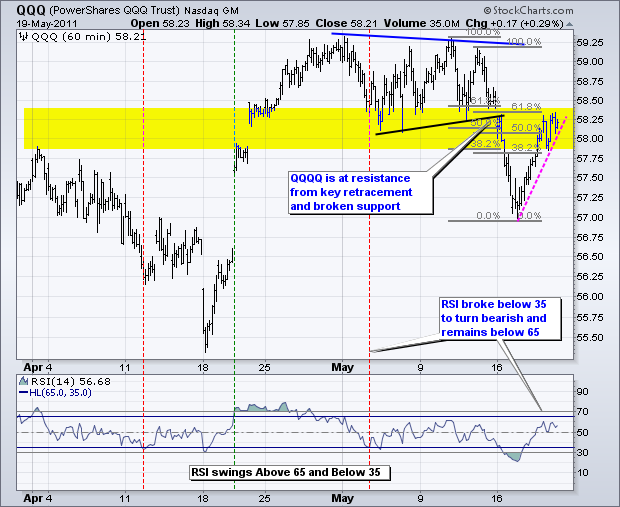
QQQ is at its make-or-break point for this oversold bounce. The ETF moved back into the broken support zone, which turns into resistance. There is also resistance in the 58.25 area from the 62% retracement cluster. The pink trendline marks the rate of ascent over the last two days. A break below this trendline would provide the first sign of weakness. RSI moved into bear mode with the break below 35, which means that 65 becomes resistance. RSI failed at 65 the first two weeks of May and is once again testing this level.

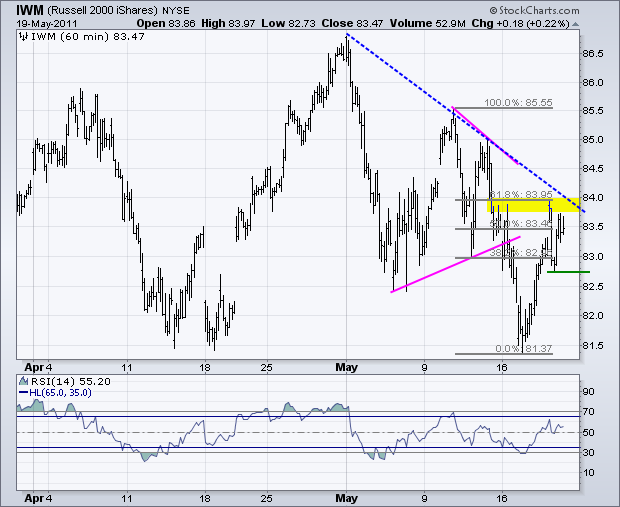
The Russell 2000 ETF (IWM) is more volatile, but is also at a make-or-break point. The ETF broke triangle resistance with a sharp decline to the April low and then bounced back into the middle of the triangle zone. Resistance in this area is confirmed by the 62% retracement, Monday's high and the early May trendline. A break above 84 would be positive here. Conversely, failure at resistance and a move below 82.70 would argue for another test of the April-May lows.

Key Economic Reports/Events:
None on Friday.
Charts of Interest: Tuesday and Thursday in separate post.
***********************************************
This commentary and charts-of-interest are designed to stimulate thinking. This analysis is not a recommendation to buy, sell, hold or sell short any security (stock ETF or otherwise). We all need to think for ourselves when it comes to trading our own accounts. First, it is the only way to really learn. Second, we are the only ones responsible for our decisions. Think of these charts as food for further analysis. Before making a trade, it is important to have a plan. Plan the trade and trade the plan. Among other things, this includes setting a trigger level, a target area and a stop-loss level. It is also important to plan for three possible price movements: advance, decline or sideways. Have a plan for all three scenarios BEFORE making the trade. Consider possible holding times. And finally, look at overall market conditions and sector/industry performance.


