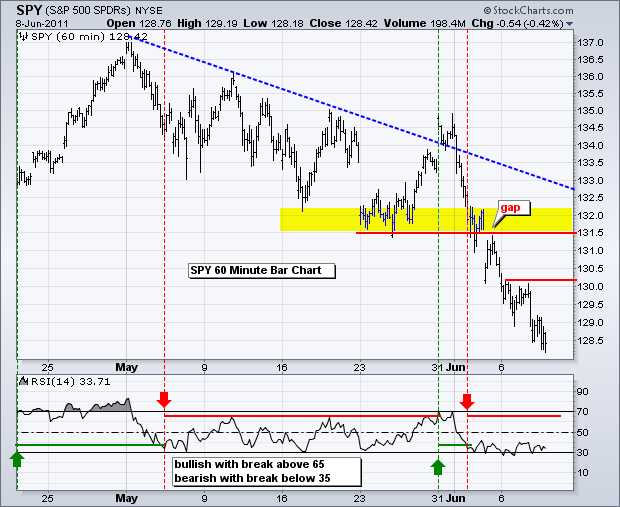
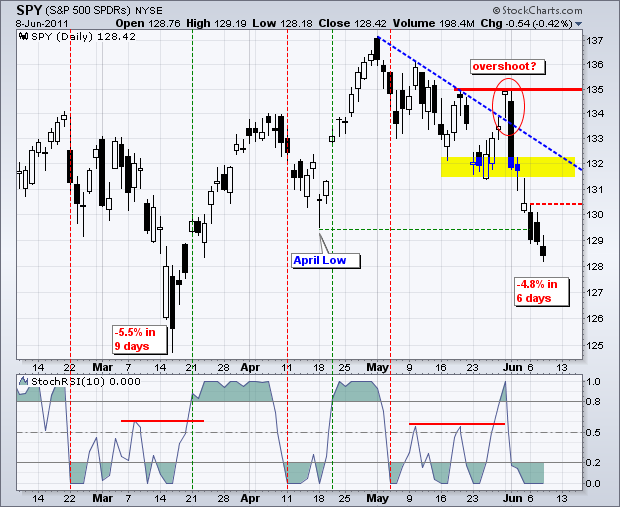
Stocks tried to firm again on Wednesday, but buying pressure remains weak or non-existent. Most of this firmness stems from less selling pressure. SPY is down around 4.8% the last six days as it moved below its April low. This makes it short-term oversold. At this point, the most I would expect is an oversold bounce, not a move that produces a short-term trend reversal (breakout). These declines often end with some sort of selling climax or a "W" type bottom with two reaction lows. We have yet to see a selling climax or a reaction low to even suggest support is at hand. A selling climax might involve a high-volume intraday plunge to the 125-126 area (the March lows) and then a recovery with a close well above these lows, perhaps above 127. At this point, I think we are in wait-and-see. The strong downtrend argues against new longs, but oversold conditions could give way to a bounce.

Key Economic Reports/Events:
Thu - Jun 09 - 08:30 - Jobless Claims
Charts of Interest: Tuesday and Thursday in separate post.
This commentary and charts-of-interest are designed to stimulate thinking. This analysis is not a recommendation to buy, sell, hold or sell short any security (stock ETF or otherwise). We all need to think for ourselves when it comes to trading our own accounts. First, it is the only way to really learn. Second, we are the only ones responsible for our decisions. Think of these charts as food for further analysis. Before making a trade, it is important to have a plan. Plan the trade and trade the plan. Among other things, this includes setting a trigger level, a target area and a stop-loss level. It is also important to plan for three possible price movements: advance, decline or sideways. Have a plan for all three scenarios BEFORE making the trade. Consider possible holding times. And finally, look at overall market conditions and sector/industry performance.


