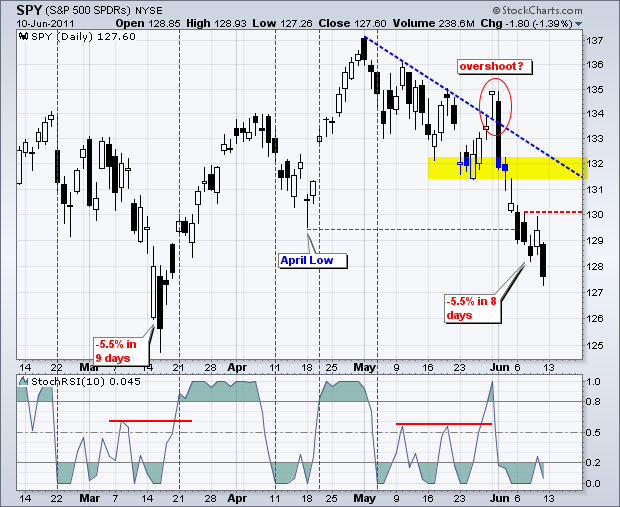
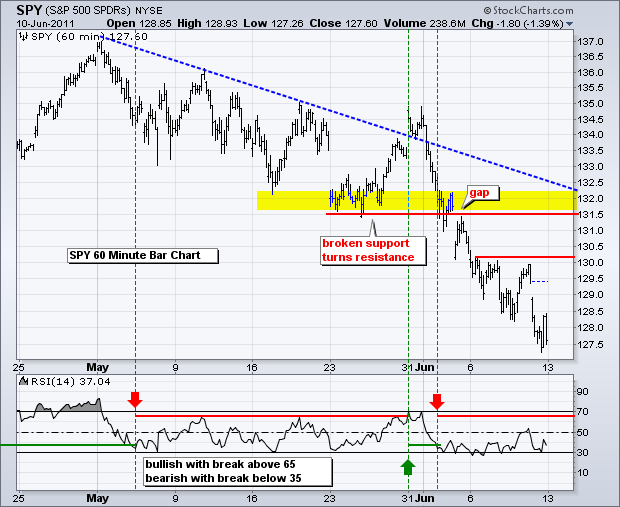
There is no change in the stock market analysis as stocks became even more oversold on Friday. The S&P 500 ETF (SPY) opened weak with a gap down and closed weak. The ETF is now down around 5.5% in the last eight days, which compares to the decline seen in March. All of the major index ETFs have broken their April lows and the March lows mark the next potential support level. In fact, IWM, QQQ and MDY are quite close to these lows already. Even though stocks are short-term oversold and ripe for a bounce, we have yet to see a selling climax or strong bullish reversal day that would signal support. Given the strength of the recent decline, I think we need to wait for some sort of selling climax or big reversal day before marking support. This could very well occur near the March lows. It is going to be a big week for economic reports. This may increase volatility enough to produce such a pattern over the next 1-2 weeks.
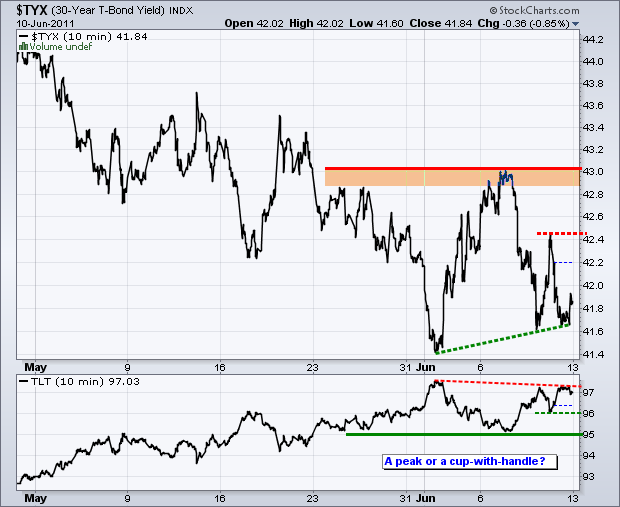
This could be a big week for bonds. The Producer Price Index (PPI) is due on Tuesday, the Consumer Price Index (CPI) on Wednesday and Leading Indicators on Friday. The first two will provide clues on inflation. Leading Indicators will provide clues on the economy. The 30-year Treasury Yield ($TYX) moved lower on Friday as the 20+ year Bond ETF (TLT) bounced. Bonds are likely to remain strong as long as stocks and the Euro are weak. The indicator window shows TLT forming a potential cup-with-handle pattern. An upside breakout would be bullish. Conversely, a break below 96 would invalidate the cup-with-handle pattern.
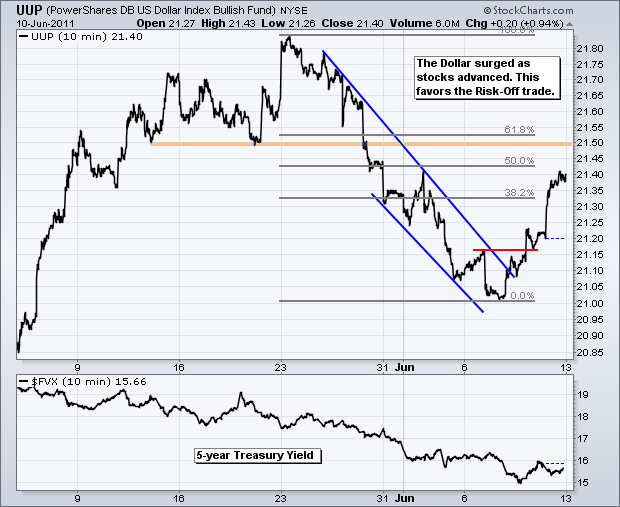
The US Dollar Fund (UUP) surged last week as stocks continued to fall. Money is moving out of the Euro, which favors the risk-off trade. Bonds benefit in a risk-off environment, while stocks and oil suffer. The surge in the Dollar looks strong with the first resistance area around 21.5. Broken support and the 50-62% retracement zone mark resistance here.
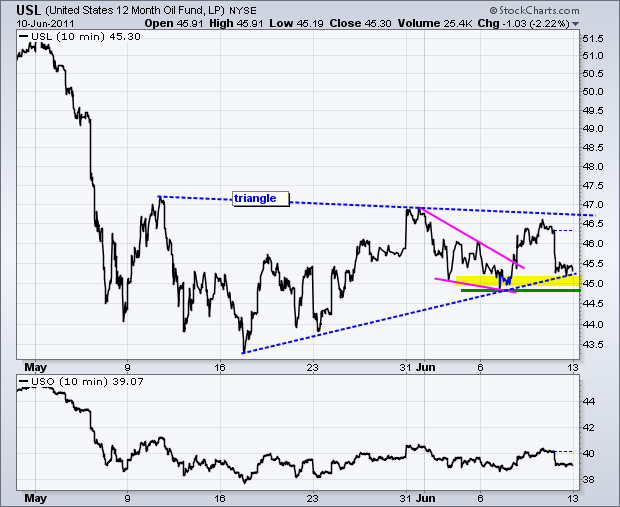
The 12-Month US Oil Fund (USL) took a hit along with the stock market on Friday. Overall, the ETF has a large triangle working since the sharp decline in early May. USL is currently testing support from the June low. A break below this level would signal a continuation of the May decline. Fundamentally, crude is under pressure because weakness in the economy will limit demand and an increase in output from Saudi Arabia will increase supply.
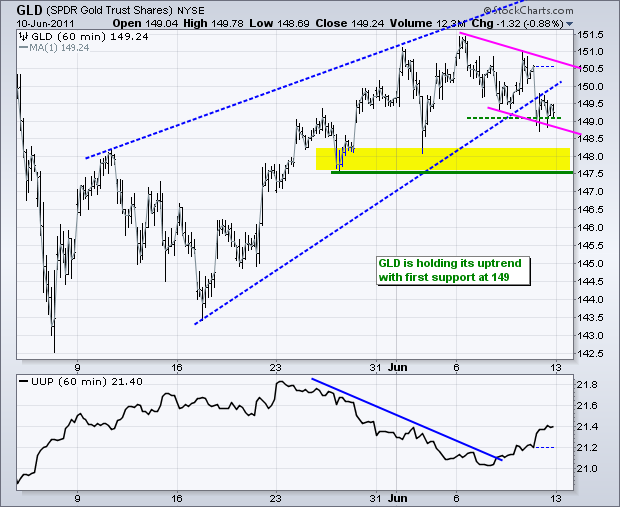
The Gold SPDR (GLD) moved sharply lower on Friday. This was likely a response to a strong Dollar and weakness in crude. The ETF broke the lower trendline of a rising wedge, but remains above the big support zone around 148. Gold could still attract money as an alternative to stocks, bonds, the Dollar and the Euro.
Key Economic Reports/Events:
Tue - Jun 14 - 08:30 - Retail Sales
Tue - Jun 14 - 08:30 - Producer Price Index (PPI)
Tue - Jun 14 - 10:00 - Business Inventories
Wed - Jun 15 - 08:30 - Consumer Price Index (CPI)
Wed - Jun 15 - 08:30 - Empire State Manufacturing
Wed - Jun 15 - 09:15 - Industrial Production
Wed - Jun 15 - 10:00 - NAHB Housing Market Index
Wed - Jun 15 - 10:30 - Oil Inventories
Thu - Jun 16 - 08:30 - Jobless Claims
Thu - Jun 16 - 08:30 - Housing Starts/Building Permits
Thu - Jun 16 - 10:00 - Philadelphia Fed
Fri - Jun 17 - 09:55 - Michigan Sentiment
Fri - Jun 17 - 10:00 - Leading Indicators
Charts of Interest: Tuesday and Thursday in separate post.
This commentary and charts-of-interest are designed to stimulate thinking. This analysis is not a recommendation to buy, sell, hold or sell short any security (stock ETF or otherwise). We all need to think for ourselves when it comes to trading our own accounts. First, it is the only way to really learn. Second, we are the only ones responsible for our decisions. Think of these charts as food for further analysis. Before making a trade, it is important to have a plan. Plan the trade and trade the plan. Among other things, this includes setting a trigger level, a target area and a stop-loss level. It is also important to plan for three possible price movements: advance, decline or sideways. Have a plan for all three scenarios BEFORE making the trade. Consider possible holding times. And finally, look at overall market conditions and sector/industry performance.

