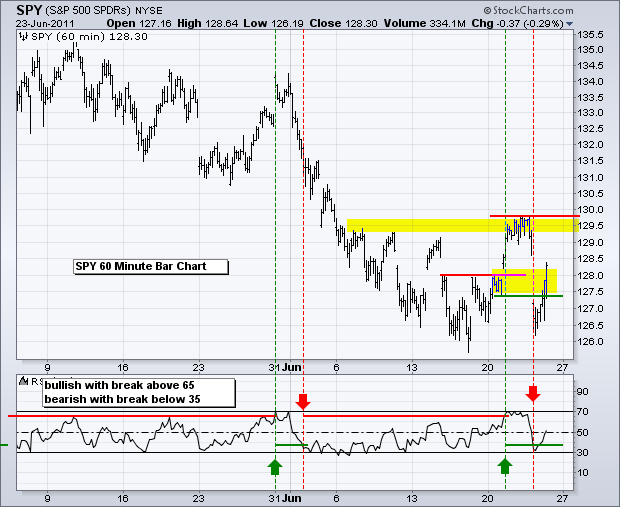
The battle for support from the March lows continues to rage. Stocks opened sharply lower on Thursday, remained weak and then mounted a strong afternoon rally. This rebound pushed QQQ and IWM into positive territory by the close and cut most of the losses in SPY. On the 60-minute chart, SPY opened below the first support zone, but held above last week's lows and closed above 128. The ETF now has four gaps in the last eight days and at least four 2% swings in the last two weeks. RSI plunged below 35 and then recovered. All in all, the short-term situation is one big mess as SPY gyrates within a volatile trading range. With the prior move down, I think the overall bias remains down. The onus remains on the bulls to prove otherwise. A solid break above 130 would reverse the short-term downtrend. At this point, I would be inclined to see this breakout first and judge breadth before taking it seriously.
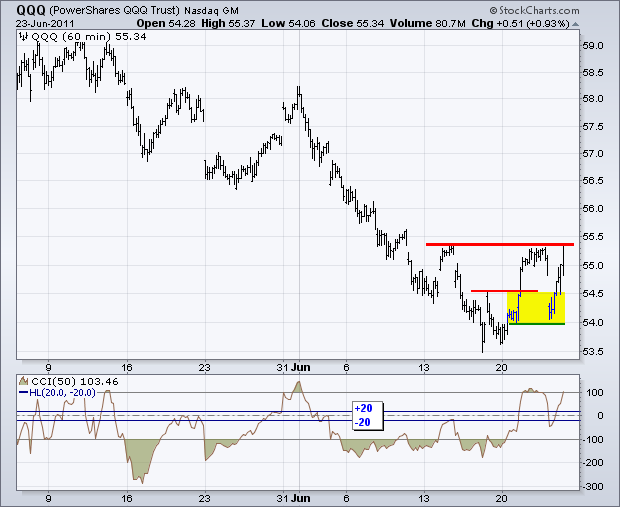
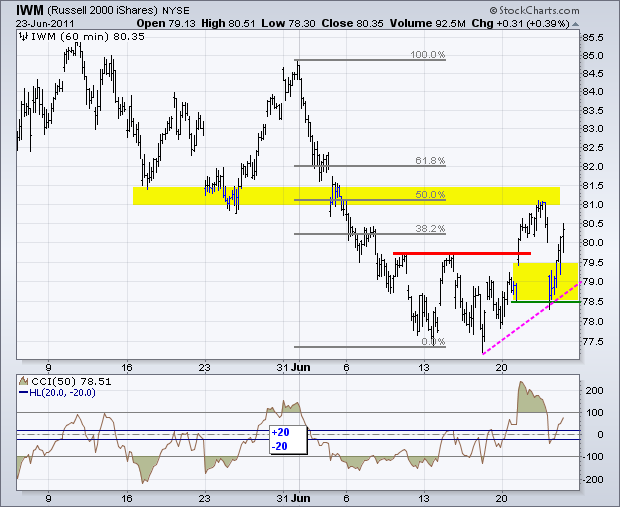
The Russell 2000 ETF (IWM) dipped into its support zone and briefly broke 78.5 on the open. This small-cap ETF was rather quick to firm and managed to move back above the breakout. IWM still looks like the strongest of the three, with QQQ second. I will leave short-term support at 78.50 for now.
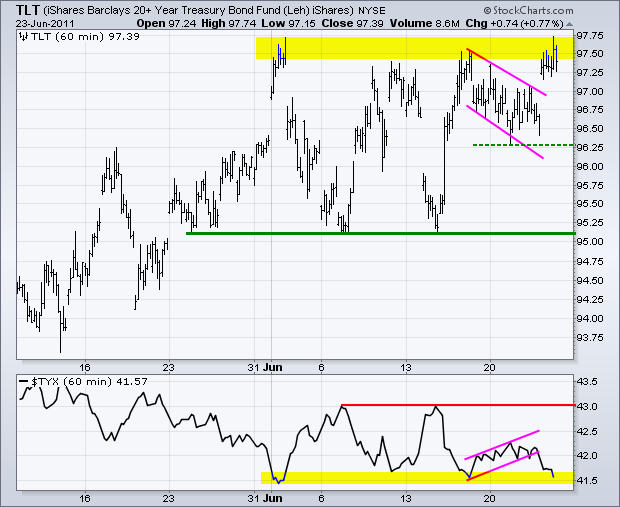
The 30-year Treasury Yield ($TYX) broke rising flag support as the 20+ year Bond ETF (TLT) broke falling flag resistance. The upside breakout in bonds tells us that money is looking for safety, not return. The flag low around 96.25 marks the first important support level to watch for a breakdown in bonds that would benefit stocks.
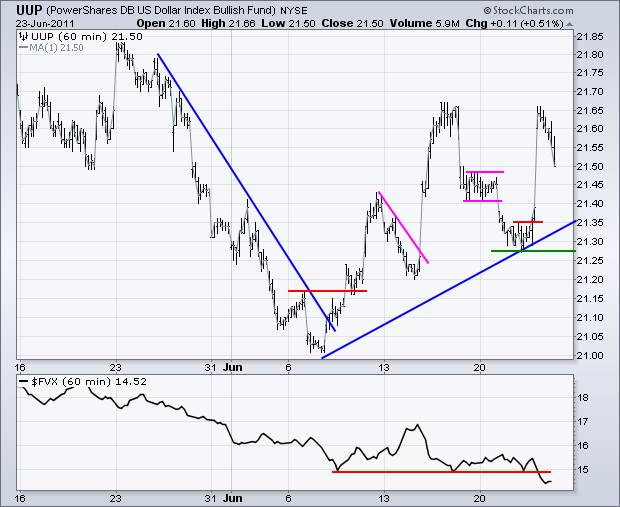
The US Dollar Fund (UUP) is all over the place as Euro volatility drives price action. Overall, the trend is up since the breakout on the second week of June. There is a support zone marked by this week's lows. A break below these lows would reverse the short-term upswing.
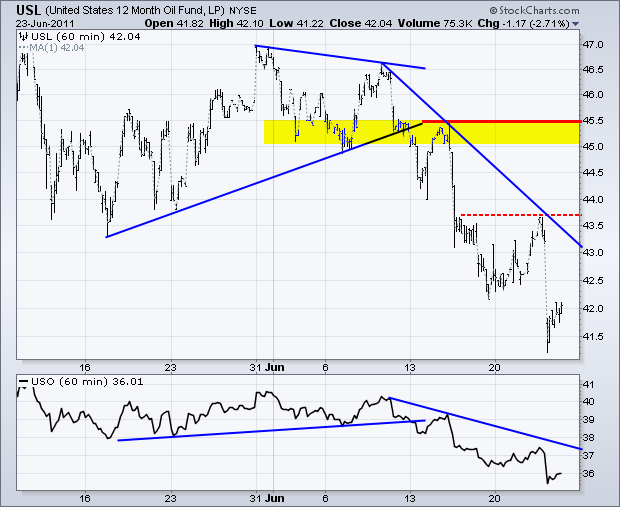
Oil remains extraordinarily weak with another sharp move lower on Thursday. The 12-Month US Oil Fund (USL) broke down in mid June and quickly declined to the low 40s. The ETF is down around 10% from its early June high. This week's high marks the first resistance level to watch.
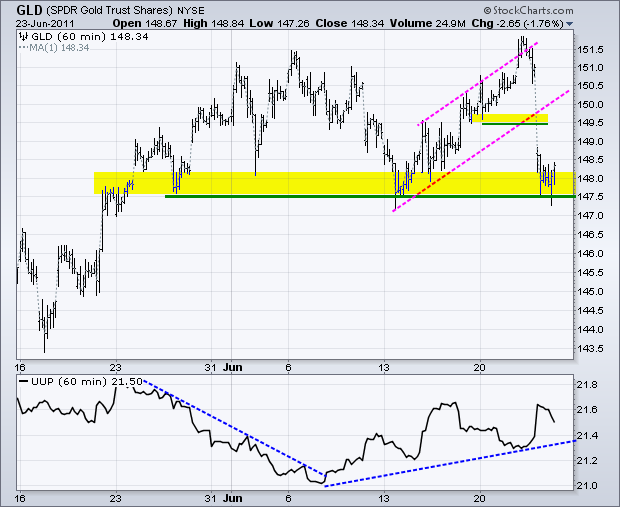
The Gold SPDR (GLD) also took it on the chin with a sharp decline on Thursday. This may be tied to the sharp decline in oil and the possibility of slower economic growth (globally), which would decrease demand in Asia. GLD is trading at an important support zone around 147.5. A break here would open the door to the mid May lows.
Key Economic Reports:
Jun 24 08:30 GDP
Jun 24 08:30 Durable Orders
Chart of Interest: Tuesday and Thursday in separate post.
This commentary and charts-of-interest are designed to stimulate thinking. This analysis is not a recommendation to buy, sell, hold or sell short any security (stock ETF or otherwise). We all need to think for ourselves when it comes to trading our own accounts. First, it is the only way to really learn. Second, we are the only ones responsible for our decisions. Think of these charts as food for further analysis. Before making a trade, it is important to have a plan. Plan the trade and trade the plan. Among other things, this includes setting a trigger level, a target area and a stop-loss level. It is also important to plan for three possible price movements: advance, decline or sideways. Have a plan for all three scenarios BEFORE making the trade. Consider possible holding times. And finally, look at overall market conditions and sector/industry performance.

