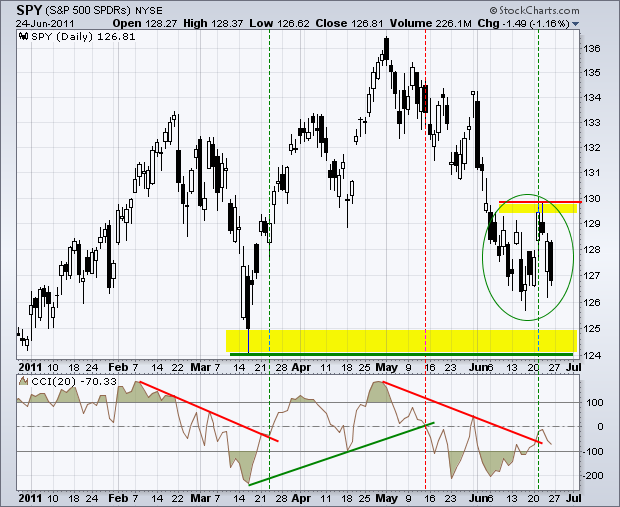
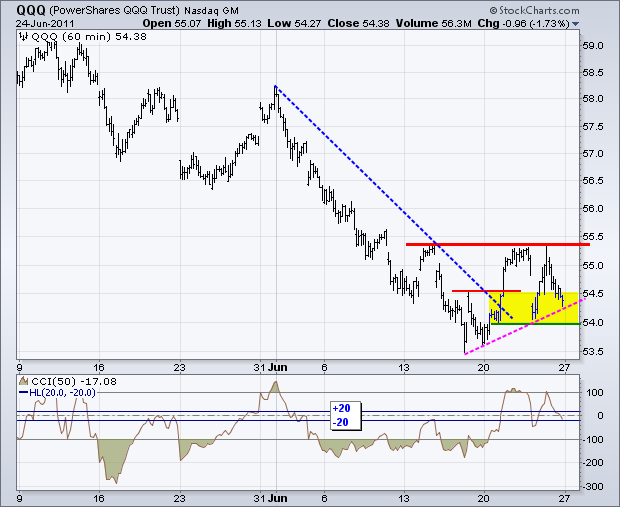
Trading was quite volatile last week as the S&P 500 ETF (SPY) failed to hold Tuesday's gap and finished the week with a small loss. SPY gapped up and closed above 129 on Tuesday, stalled on Wednesday and then gapped down on Thursday. Despite this sharp gap down, the ETF surged above 128 by the close to form a long white candlestick. Thursday's intraday surge was completely erased on Friday with a long black candlestick and weak close. The inability to hold Tuesday's surge above 129 and Thursday's close above 128 shows underlying weakness that could give way to a test of the March lows. Overall, SPY has gone nowhere since June 8th. As the green oval shows, the ETF has traded on either side of 128 the last 13 trading days. This amounts to one volatile consolidation after a sharp decline. A move below 126 signals a continuation lower, while a break above the consolidation highs would be short-term bullish. A CCI move above zero would confirm an upside breakout in SPY.
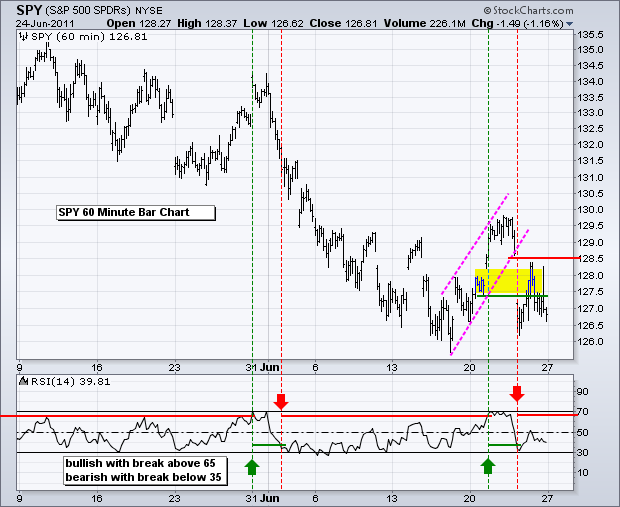
The Russell 2000 ETF (IWM) remains the strongest of the big three (QQQ, IWM, SPY). IWM broke resistance with a big surge on Tuesday. The support zone around 78.5-79 ultimately held after Thursday's gap down and the ETF remained above the support zone on Friday. A move below 78.5 would signal a breakdown in this small-cap dominated ETF.
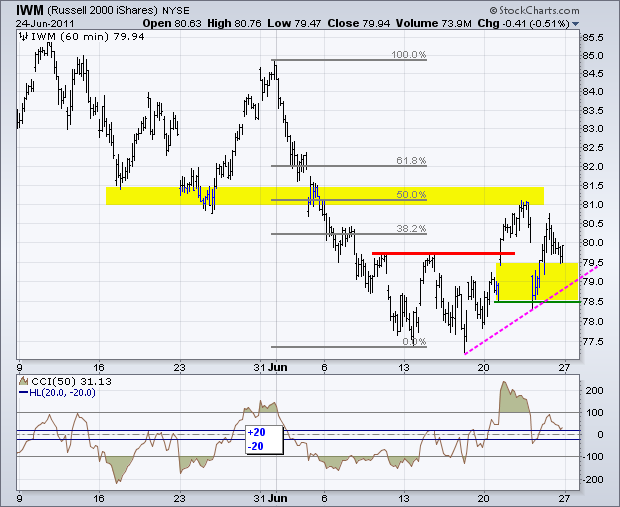
The Nasdaq 100 ETF (QQQ) failed to exceed its mid June high with Tuesday's surge, but held the 54-54.5 support zone on Thursday and Friday. A small inverse Head-and-Shoulders is be taking shape with neckline resistance at 55.40 (thick red line). A move below 54 would signal a short-term breakdown.
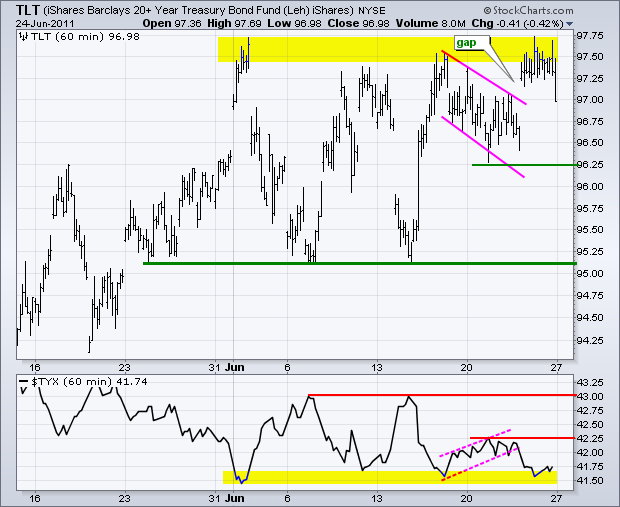
The 20+ year Bond ETF (TLT) broke falling flag resistance with a gap and surge on Thursday, but stalled near bigger resistance from the June high. The big trend (since mid February) remains up for TLT and the ETF has been consolidating in the 95-97.5 most of June. The flag lows mark short-term support at 96.25, while the June lows mark a key medium-term support level just above 95. Bond action could depend on the Euro and the stock market. Further weakness in both would be positive for US Treasuries because they are viewed as a safe-haven.
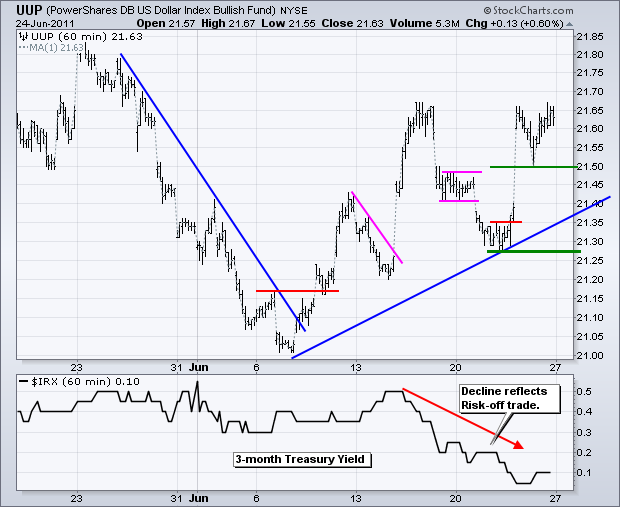
The US Dollar Fund (UUP) found support at 21.50 and surged back to its mud June highs to keep the uptrend alive. First support is now marked here. The ETF has been rising since the second week of June with the most recent reaction low marking support in the 21.27 area. The indicator window shows the 3-month T-Bill Yield ($IRX) declining since mid June. This means money is moving into T-Bills, which yield almost zero. Buying of T-Bills reflects the current risk-off environment. An upturn in the T-Bill yield would be positive for stocks and negative for the Dollar.
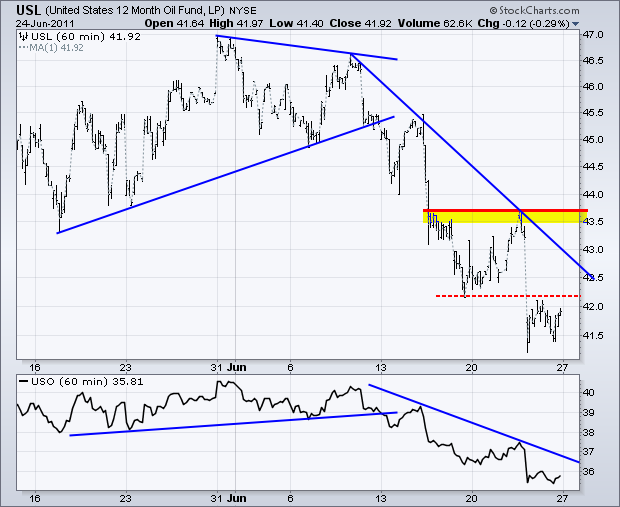
Oil plunged on Thursday as the US led a coordinated effort to release of stockpiles. The mere threat of more releases could keep oil prices under pressure. On the chart, the 12-Month US Oil Fund (USL) broke down in mid June and traced out a series of lower lows the last two weeks. I am marking key resistance just above 43.50.
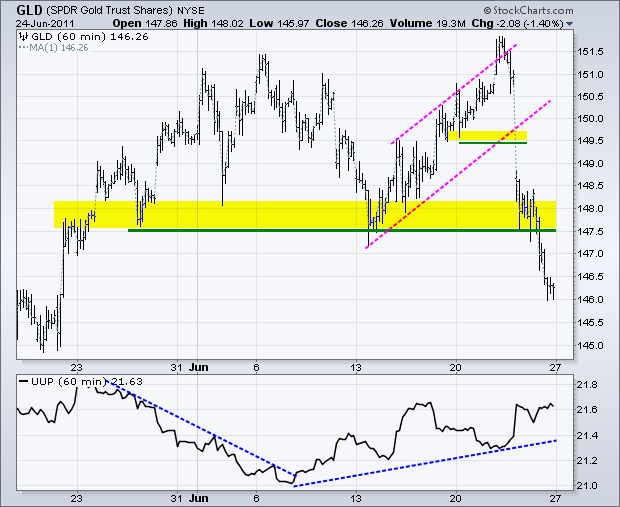
Gold may be taking its cue from weakness in oil. Even though the Gold SPDR (GLD) surged above 151.50 last week, it quickly relinquished its gains and plunged below support. This move also broke the trendline extending up from late January. The next support zone marks medium-term support in the 142-144 area.
Key Economic Reports:
Mon - Jun 27 - 08:30 - Personal Income & Spending
Tue - Jun 28 - 09:00 - Case-Shiller 20-city Index
Tue - Jun 28 - 10:00 - Consumer Confidence
Wed - Jun 29 - 07:00 - MBA Mortgage Index
Wed - Jun 29 - 10:00 - Pending Home Sales
Wed - Jun 29 - 10:30 - Oil Inventories
Thu - Jun 30 - 08:30 - Jobless Claims
Thu - Jun 30 - 09:45 - Chicago PMI
Fri - Jul 01 - 09:55 - Michigan Sentiment
Fri - Jul 01 - 10:00 - ISM Index
Fri - Jul 01 - 10:00 - Construction Spending
Fri - Jul 01 - 15:00 - Auto/Truck Sales
Chart of Interest: Tuesday and Thursday in separate post.
This commentary and charts-of-interest are designed to stimulate thinking. This analysis is not a recommendation to buy, sell, hold or sell short any security (stock ETF or otherwise). We all need to think for ourselves when it comes to trading our own accounts. First, it is the only way to really learn. Second, we are the only ones responsible for our decisions. Think of these charts as food for further analysis. Before making a trade, it is important to have a plan. Plan the trade and trade the plan. Among other things, this includes setting a trigger level, a target area and a stop-loss level. It is also important to plan for three possible price movements: advance, decline or sideways. Have a plan for all three scenarios BEFORE making the trade. Consider possible holding times. And finally, look at overall market conditions and sector/industry performance.

