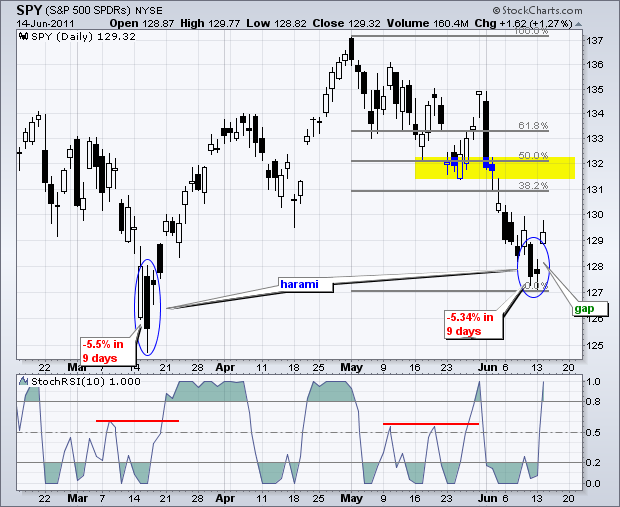
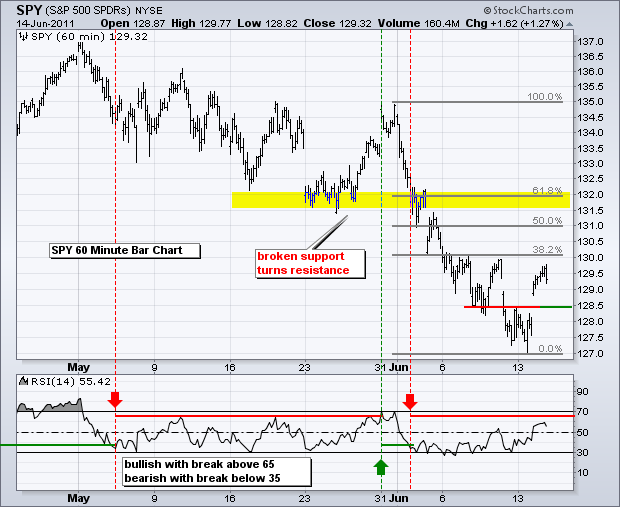
Stocks surged with a broad advance that lifted most boats. Net Advances and Net Advancing Volume on both the Nasdaq and NYSE surged as well. These breadth surges were comparable to the breadth surges seen at the mid March and mid April lows. Also note that SPY formed a Harami at the mid March low and gapped up to solidify the mid April low. SPY has both a Harami and a gap over the last three days. Is the market ripe for a "V" bottom like those seen in mid March and mid April? Personally, I think not. I think there will be some backing and filling or perhaps a test of the mid June low or even the March low. SPY was extremely oversold after a 5.34% decline in nine days and deserves an oversold bounce. As the 60-minute chart shows, the first Fibonacci Retracement (38.2%) is coming into play as short-term resistance.
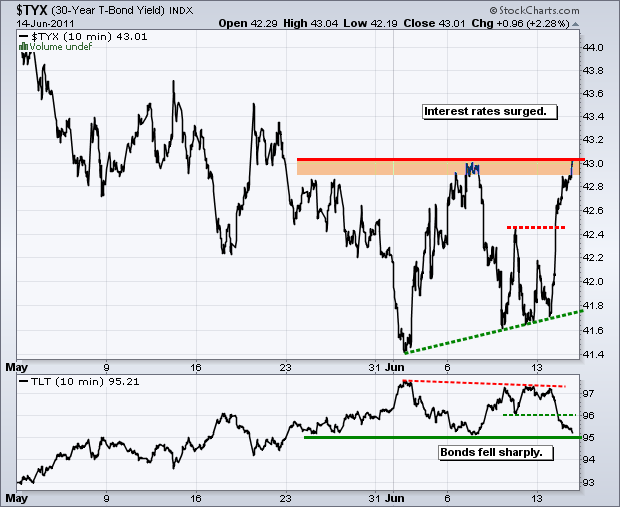
The 20+ year Bond ETF (TLT) and the 7-10 year Bond ETF (IEF) both broke resistance levels as yields fell sharply on Tuesday. The first chart shows the 30-year Treasury Yield ($TYX) breaking above last week's high and challenging the June high. TLT broke last week's low and is testing the June low.
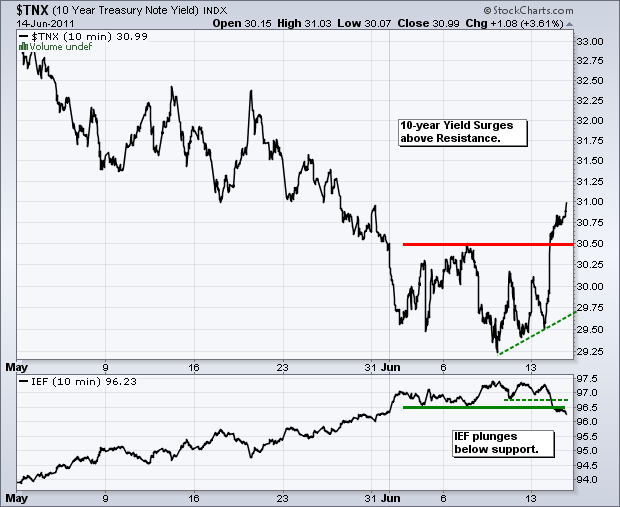
The next chart shows the 10-year Treasury Yield ($TNX) breaking above its June high with a big surge as the 7-10 year Bond ETF (IEF) breaks below its June lows. The plunge in bonds was also facilitated by a surge in stocks. The Labor Department reported a .2% increase in the Producer Price Index (PPI). The Consumer Price Index (CPI) will be reported this morning before the open.
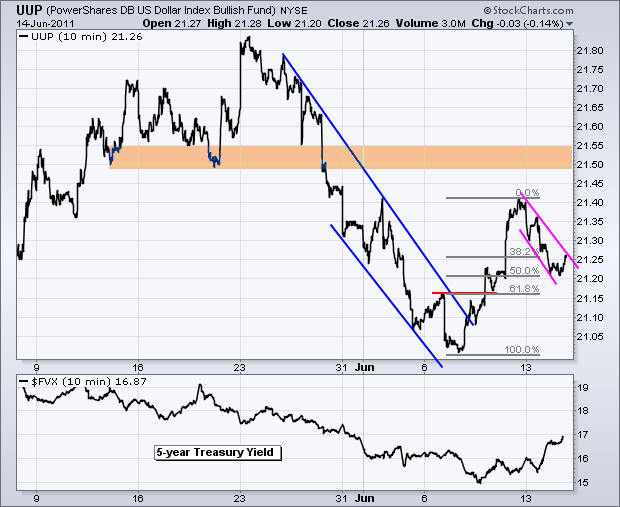
The US Dollar Fund (UUP) pulled back after a big surge last week. This pullback looks like a falling flag or channel, which looks like a bullish correction. Notice that the pullback retraced 50% of the prior surge. UUP remains just above last week's breakout point. This is a logical area for support and a continuation of the June surge. The Euro is under pressure this morning as the Greek bailout drags on without a decision from Eurocrats.
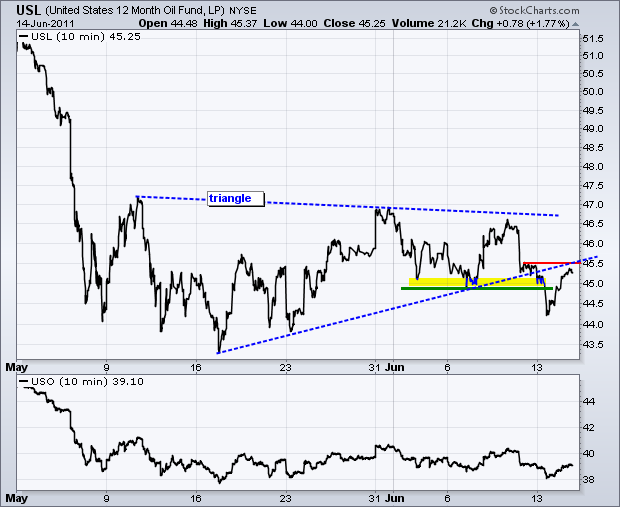
After breaking support with a sharp decline on Monday, the 12-Month US Oil Fund (USL) rebounded along with the stock market on Tuesday. However, the support break remains and resistance is nigh. The trendline extension and Friday afternoon highs mark resistance at 45.5.
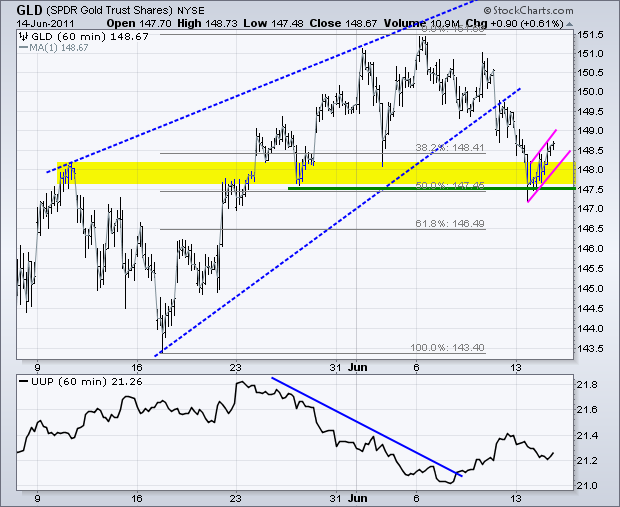
The Gold SPDR (GLD) got a bounce off the support zone around 147.5-148. This support zone extends back to broken resistance from the early May high. The 147.5 level also marks a 50% retracement of the prior advance. This is a good spot for a bounce. The only concern is that a small rising flag could be taking shape on Wednesday. A move below 147.5 would argue for further short-term weakness. Gold remains one of the few alternatives to government debt and currencies.
Key Economic Reports/Events:
Wed - Jun 15 - 08:30 - Consumer Price Index (CPI)
Wed - Jun 15 - 08:30 - Empire State Manufacturing
Wed - Jun 15 - 09:15 - Industrial Production
Wed - Jun 15 - 10:00 - NAHB Housing Market Index
Wed - Jun 15 - 10:30 - Oil Inventories
Thu - Jun 16 - 08:30 - Jobless Claims
Thu - Jun 16 - 08:30 - Housing Starts/Building Permits
Thu - Jun 16 - 10:00 - Philadelphia Fed
Fri - Jun 17 - 09:55 - Michigan Sentiment
Fri - Jun 17 - 10:00 - Leading Indicators
This commentary and charts-of-interest are designed to stimulate thinking. This analysis is not a recommendation to buy, sell, hold or sell short any security (stock ETF or otherwise). We all need to think for ourselves when it comes to trading our own accounts. First, it is the only way to really learn. Second, we are the only ones responsible for our decisions. Think of these charts as food for further analysis. Before making a trade, it is important to have a plan. Plan the trade and trade the plan. Among other things, this includes setting a trigger level, a target area and a stop-loss level. It is also important to plan for three possible price movements: advance, decline or sideways. Have a plan for all three scenarios BEFORE making the trade. Consider possible holding times. And finally, look at overall market conditions and sector/industry performance.

