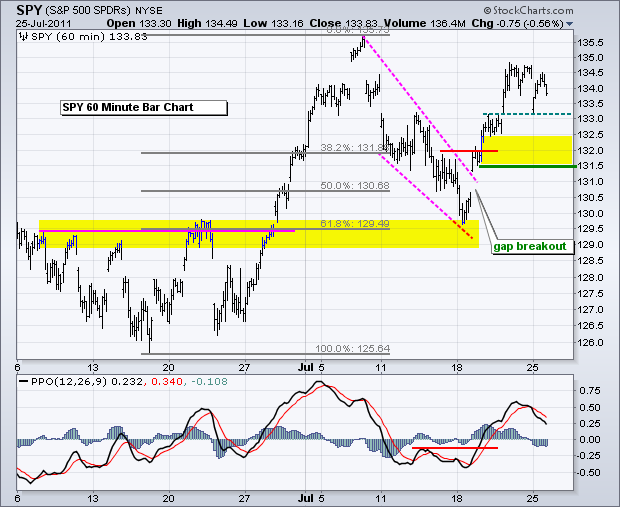
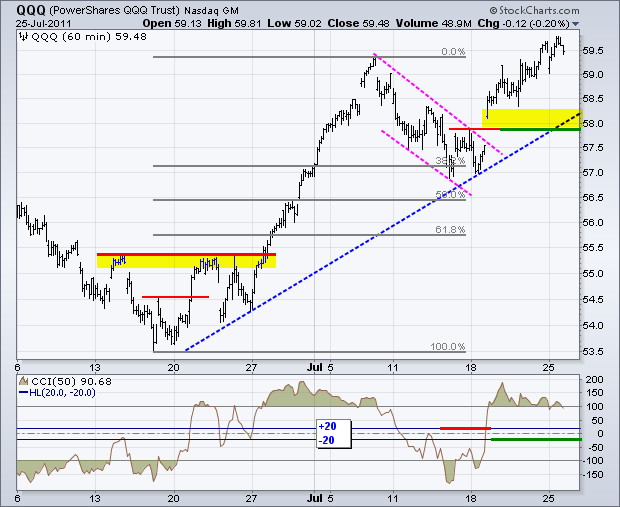
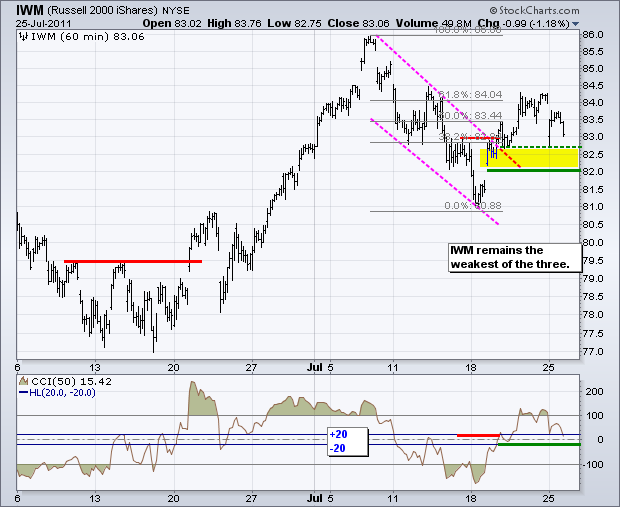
The debt duel in Washington is weighing on stocks, bonds and the Dollar. Techs and QQQ are holding up the best, while small-caps and IWM are faring the worst. This debt duel will soon turn from rumor to news (on or before August 2nd). This news, whatever the outcome, could lead to a relief rally. The question now is what happens between now and August 2nd. While we cannot predict what will happen in Washington, we can watch the charts for clues based on trends, support and resistance. Support is key in an uptrend, while resistance is key in a downtrend. A move below support reverses the uptrend, while a break above resistance reverses the downtrend. The major index ETFs are currently in short-term uptrends and I am watching key support zones for signs of a trend reversal. These are marked with yellow on the charts. I am also watching a few key momentum oscillators. A break below -20 in CCI and dip into negative territory for the Percent Price Oscillator (PPO) would be bearish for short-term momentum.
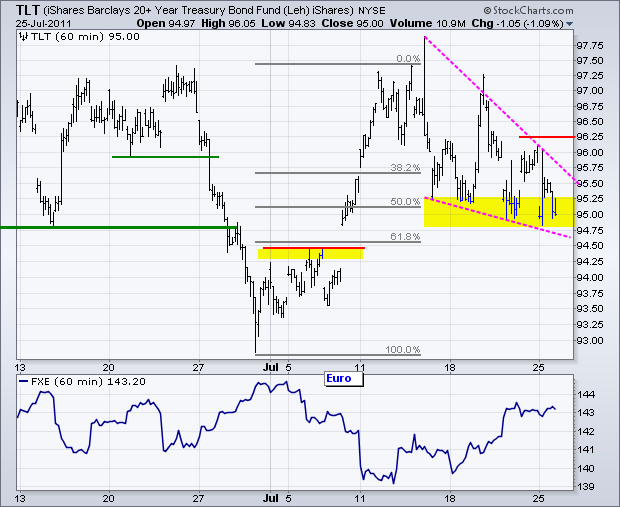
The 20+ year Bond ETF (TLT) remains under pressure as it tests support n the 95 are. At this point, I am prepared to call the short-term trend down and focus on a key resistance point for a trend reversal. I elected to draw through last week's spike and tighten the falling wedge. A move above 96.25 would break the upper trendline and exceed resistance from Friday's high.
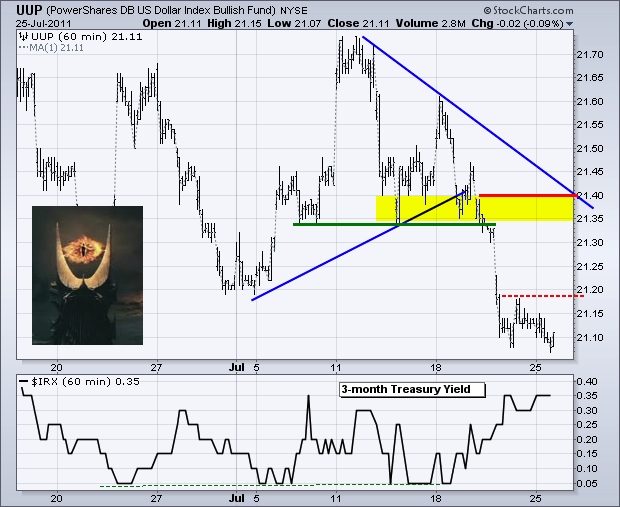
The US Dollar Fund (UUP) is taking a big hit in pre-market trading (as of 5AM ET). The ETF broke down last week as the Eye of Sauron (Lord of the Rings) changed focus from Europe to the US. With another sharp move lower expected today, a minor resistance level will be established at 21.20. Broken support turns into key resistance at 21.40.
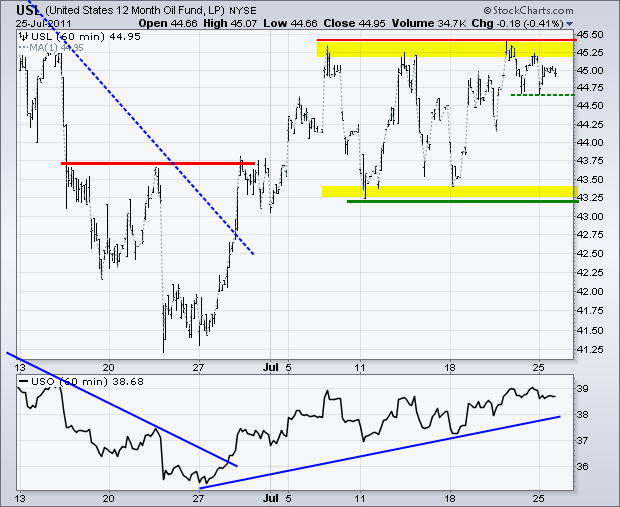
Weakness in the Dollar may help oil, but weakness in stocks could weigh on oil. No wonder oil barely moved on Monday. The 12-Month US Oil Fund (USL) is consolidating near a resistance zone. The bias remains bullish because the prior move was up (41.25 to 45.5) and the current move is flat (3-week consolidation). A break above the July highs would be bullish and argue for a move towards the upper 40's.
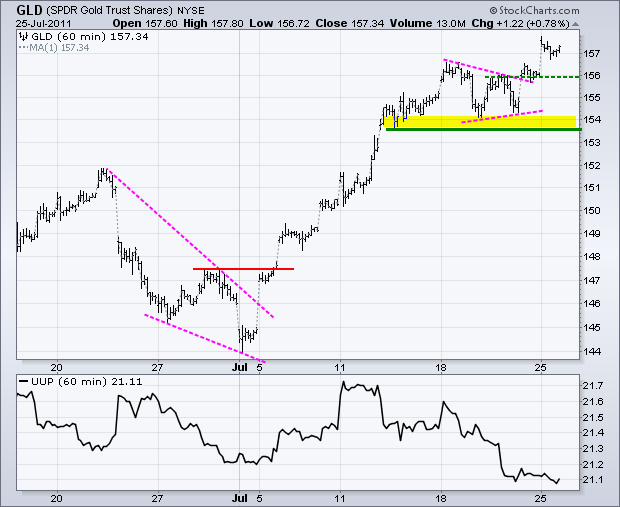
Gold, the world's reserve currency, continues to attract interest as debt problems rotate around the developed world. There is no change this setup as the Gold SPDR (GLD) broke triangle resistance on Friday and continued higher on Monday. Broken resistance turns into first support. Last week's lows mark key support.
Key Economic Reports:
Tue - Jul 26 - 09:00 - Case-Shiller Housing Index
Tue - Jul 26 - 10:00 - Consumer Confidence
Tue - Jul 26 - 10:00 - New Home Sales
Wed - Jul 27 - 07:00 - MBA Mortgage Index
Wed - Jul 27 - 08:30 - Durable Goods Orders
Wed - Jul 27 - 10:30 - Oil Inventories
Wed - Jul 27 - 14:00 - Fed Beige Book
Thu - Jul 28 - 08:30 - Jobless Claims
Fri - Jul 29 - 08:30 - GDP
Fri - Jul 29 - 09:45 - Chicago Purchasing Managers Index (PMI)
Fri - Jul 29 - 09:55 - Michigan Sentiment
Charts of Interest: Tuesday and Thursday in separate post.
This commentary and charts-of-interest are designed to stimulate thinking. This analysis is not a recommendation to buy, sell, hold or sell short any security (stock ETF or otherwise). We all need to think for ourselves when it comes to trading our own accounts. First, it is the only way to really learn. Second, we are the only ones responsible for our decisions. Think of these charts as food for further analysis. Before making a trade, it is important to have a plan. Plan the trade and trade the plan. Among other things, this includes setting a trigger level, a target area and a stop-loss level. It is also important to plan for three possible price movements: advance, decline or sideways. Have a plan for all three scenarios BEFORE making the trade. Consider possible holding times. And finally, look at overall market conditions and sector/industry performance.


