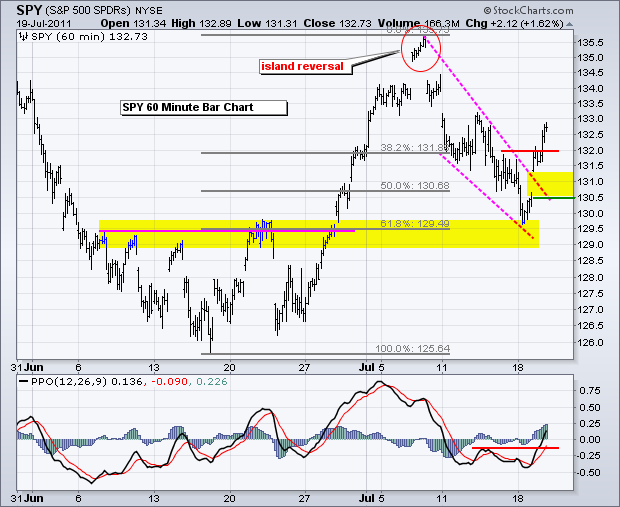
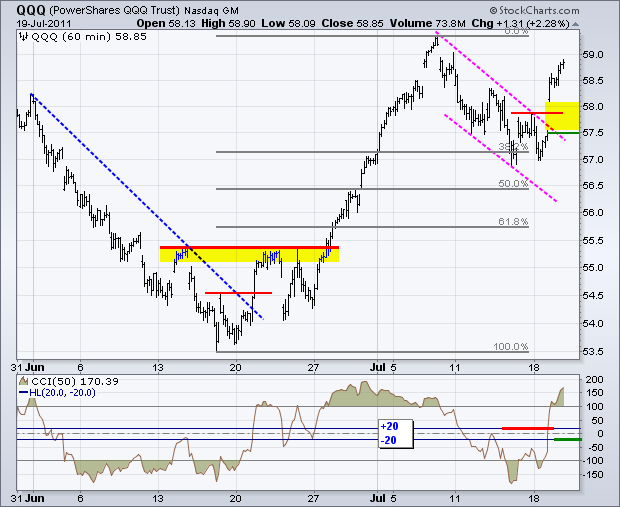
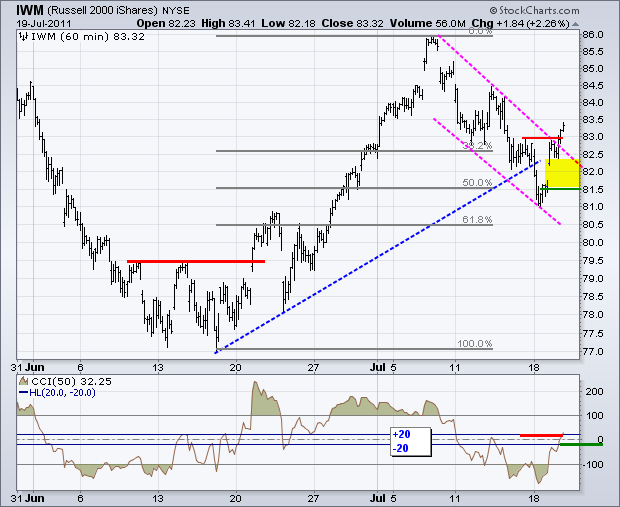
Led by the technology and consumer discretionary sectors, stocks surged on Tuesday and the major index ETFs broke channel resistance. All nine sectors were up with seven of nine up more than 1%. Tuesday's trading started strong with a gap and finished strong with a close near the high for the day. These gaps and breakout areas now mark the first support zones to watch. A strong breakout should hold. A quick move back into the gap zones would cast a shadow on the breakout. A move below Monday's close would totally fill the gaps to negate the breakouts. On the 60-minute chart, SPY gapped above the wedge trendline and broke resistance at 132. The Percent Price Oscillator (PPO) broke above last week's high and moved into positive territory. The 130.50-131.50 zone marks the first support zone to watch. A move below 130.5 would negate the breakout to put the bears back in the driver's seat.
The 20+ year Bond ETF (TLT) found support near the 50% retracement mark and the late June trendline. After firming around 95.25 Monday, the bond ETF surged above 97 with a sharp rally yesterday. This rally is interesting because it occurred as stocks were moved higher. Key support is now set at 95.
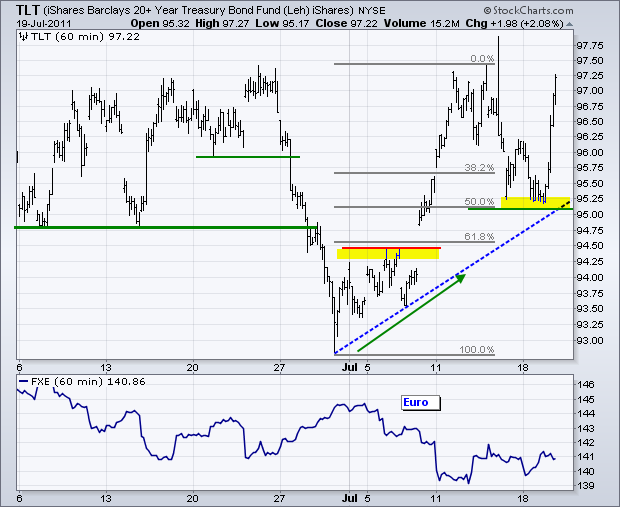
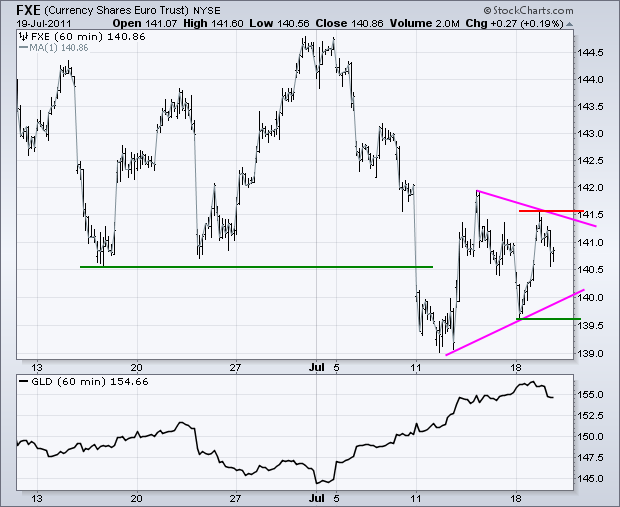
Instead of the US Dollar Fund (UUP), I will show the Euro Currency Trust (FXE) because a clear triangle has taken shape the last few days. FXE broke support with a sharp decline in early July and then stalled with this consolidation. A break from this week's range will trigger the next signal: above 141.6 to turn bullish and below 139.5 to turn bearish.
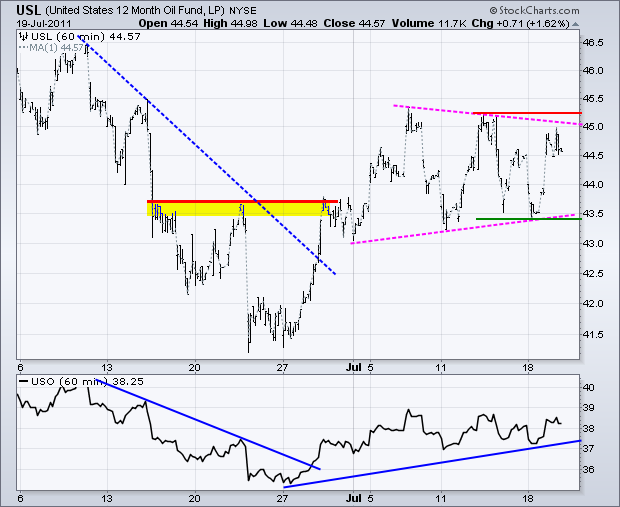
Oil seems to be hinging on stocks and the Dollar. Strength in stocks and weakness in the Dollar is bullish for oil. The 12-Month US Oil Fund (USL) surged from 41.5 to 45 and then formed a triangle consolidation. As with the Euro, the ensuing break will trigger the next directional signal. A move above 45.3 would be bullish, while a move below 43.4 would be bearish.
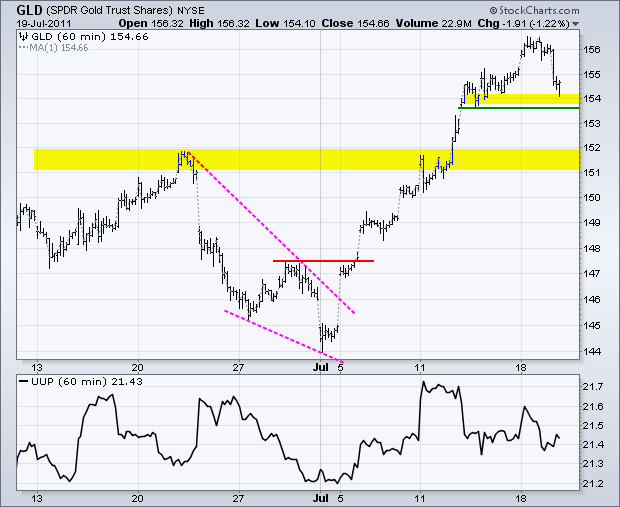
After a big surge above 156 in early July, the Gold SPDR (GLD) pulled back with a sharp decline on Tuesday. This is not enough to reverse the uptrend, but gold could be in for more corrective action as it works off overbought conditions and the European debt problems move to the back burner again.
Key Economic Reports:
Wed - Jul 20 - 10:00 - Existing Home Sales
Wed - Jul 20 - 10:30 - Oil Inventories
Thu - Jul 21 - 08:30 - Jobless Claims
Thu - Jul 21 - 10:00 - Philadelphia Fed
Thu - Jul 21 - 10:00 - Leading Indicators
Chart of Interest: Tuesday and Thursday in separate post.
This commentary and charts-of-interest are designed to stimulate thinking. This analysis is not a recommendation to buy, sell, hold or sell short any security (stock ETF or otherwise). We all need to think for ourselves when it comes to trading our own accounts. First, it is the only way to really learn. Second, we are the only ones responsible for our decisions. Think of these charts as food for further analysis. Before making a trade, it is important to have a plan. Plan the trade and trade the plan. Among other things, this includes setting a trigger level, a target area and a stop-loss level. It is also important to plan for three possible price movements: advance, decline or sideways. Have a plan for all three scenarios BEFORE making the trade. Consider possible holding times. And finally, look at overall market conditions and sector/industry performance.


