Bottom-pickers and knife-catchers are no doubt eyeing current levels as the major index ETFs tests the early August lows. After a sharp decline the first week of August, trading turned very volatile with four consecutive 4+ percent swings in SPY (down,up,down,up). There was a little follow through to the last 4+ percent surge as SPY edged above 120 early last week. This strength did not last long as stocks moved sharply lower on Thursday and Friday. The index ended the week down 4.64%. Eight of the nine sectors were also sharply lower. The Consumer Staples SPDR (XLP) edged .03% higher and the Utilities SPDR (XLU) gained 2.18% on the week. Defense was clearly the name of the game.
With last week's sharp decline, SPY is near the lows established on August 8th, 10th and 11th. Also note that an inverted hammer formed on Friday. These bullish candlestick reversals form with a long upper shadow and small body near the low of the day. The long upper shadow shows a failed intraday rally. The bulls were able to push prices higher, but were beaten back by the close. Despite the failure, the bulls did not completely give up on Friday. The high of this pattern becomes the first resistance level to watch. A move above 116 would be the first sign of a short-term trend reversal. At this point, I still consider the bigger trend down. This means any advance from current levels would be considered an oversold bounce within a bigger downtrend. Also note that the Kansas City Fed Conference in Jackson Hole starts Thursday and Bernanke is speaking on Friday at 10AM ET.


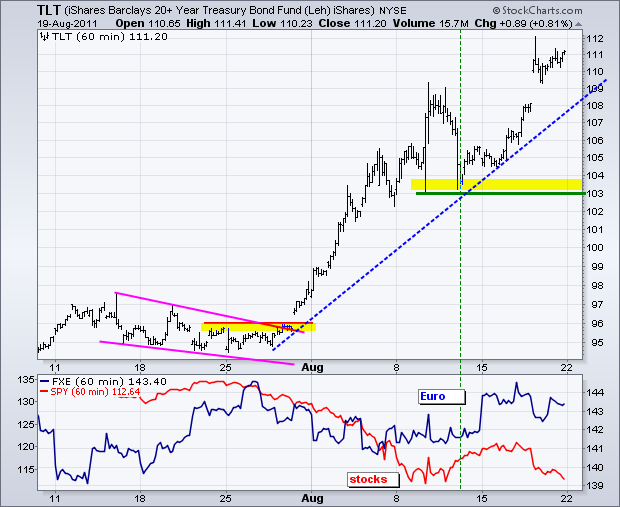
The 20+ year Bond ETF (TLT) represents the long end of the curve and the spot were bonds are rising the fastest. The 10-year Treasury Yield ($TNX) moved below its January 2009 low (±2.15%) last week, but the 30-year Treasury Yield ($TYX) remains above its January 2009 low (±2.5%). With the 30-year Treasury Yield at 3.40%, there is still room to fall before it reaches this low. Further weakness in this yield would imply further gains in TLT. Short-term, TLT is overbought after another big surge the last seven days (+7.7%). Short-term support is set at 103.
Bonds surged and stocks plunged, but the US Dollar Fund (UUP) could not forge a breakout. The markets are clearly in risk-off or safe-haven mode right now. This is a Dollar bullish environment, but the Dollar is not moving higher as UUP remains in a downtrend the last 2 1/2 weeks. Last week's high marks key resistance. A move above this level is needed to reverse the downtrend and call for a higher Dollar.

Weakness in the stock market and a deteriorating economic outlook are weighing on oil. The 12-Month US Oil Fund (USL) gapped down and moved into a short-term downtrend. A bounce in the stock market, and perhaps fall in the Dollar, would put a bid into oil. As with SPY, I am marking first resistance at Friday's high.

The Gold SPDR (GLD) chart remains the same as the 20+ year Bond ETF chart. Both are in strong uptrends bordering on parabolic. GLD is up around 14% this month alone. The steep blue trendline marks the first support, while broken resistance turns into second support in the 174 area.

Key Economic Reports:
Tue - Aug 23 - 10:00 - New Home Sales
Tue - Aug 23 - 07:45 – Chain Store Sales
Wed - Aug 24 - 07:00 - MBA Mortgage Index
Wed - Aug 24 - 08:30 - Durable Good Orders
Wed - Aug 24 - 10:30 - Oil Inventories
Thu - Aug 25 - 08:30 - Jobless Claims
Thu - Aug 25 - 08:30 – Kansas City Fed Conference in Jackson Hole
Fri - Aug 26 - 08:30 - GDP
Fri - Aug 26 - 09:55 - Michigan Sentiment
Fri - Aug 26 – 10:00 – Bernanke Speaks from Jackson Hole
Charts of Interest: Tuesday and Thursday in separate post.
This commentary and charts-of-interest are designed to stimulate thinking. This analysis is not a recommendation to buy, sell, hold or sell short any security (stock ETF or otherwise). We all need to think for ourselves when it comes to trading our own accounts. First, it is the only way to really learn. Second, we are the only ones responsible for our decisions. Think of these charts as food for further analysis. Before making a trade, it is important to have a plan. Plan the trade and trade the plan. Among other things, this includes setting a trigger level, a target area and a stop-loss level. It is also important to plan for three possible price movements: advance, decline or sideways. Have a plan for all three scenarios BEFORE making the trade. Consider possible holding times. And finally, look at overall market conditions and sector/industry performance.


